Classification Model
Given one or more inputs, a classification model tries to predict the value of one or more outcomes as labels which can be accurately applied to a dataset.Exploring TruEra Diagnostics
Powering a dynamic user interface, the TruEra Web App provides the interactive tools and controls you need to diagnose and understand your model(s) through effective analyses and visualization.
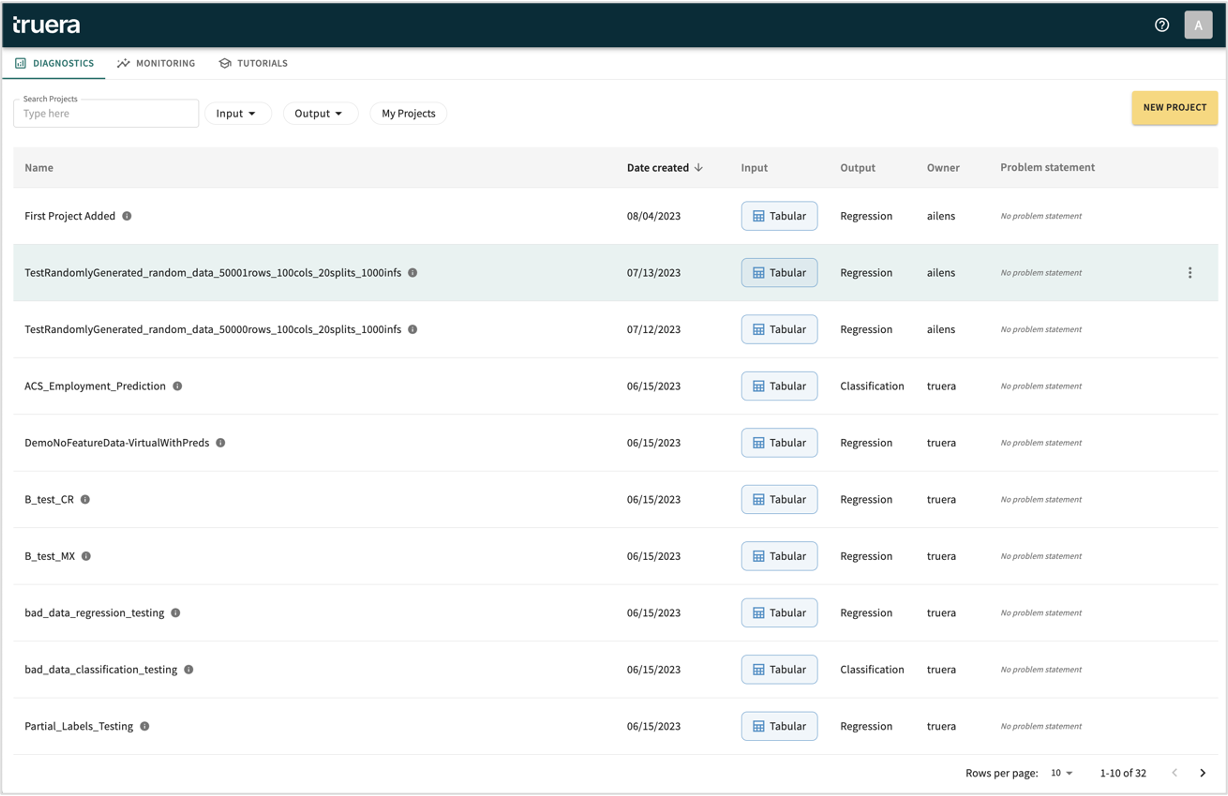
Project Control
The Web App furnishes easy point-and-click control over the projects you create in your TruEra workspace. Just click the settings icon in the toolbar in the upper-right of the window to set or change the project's settings.
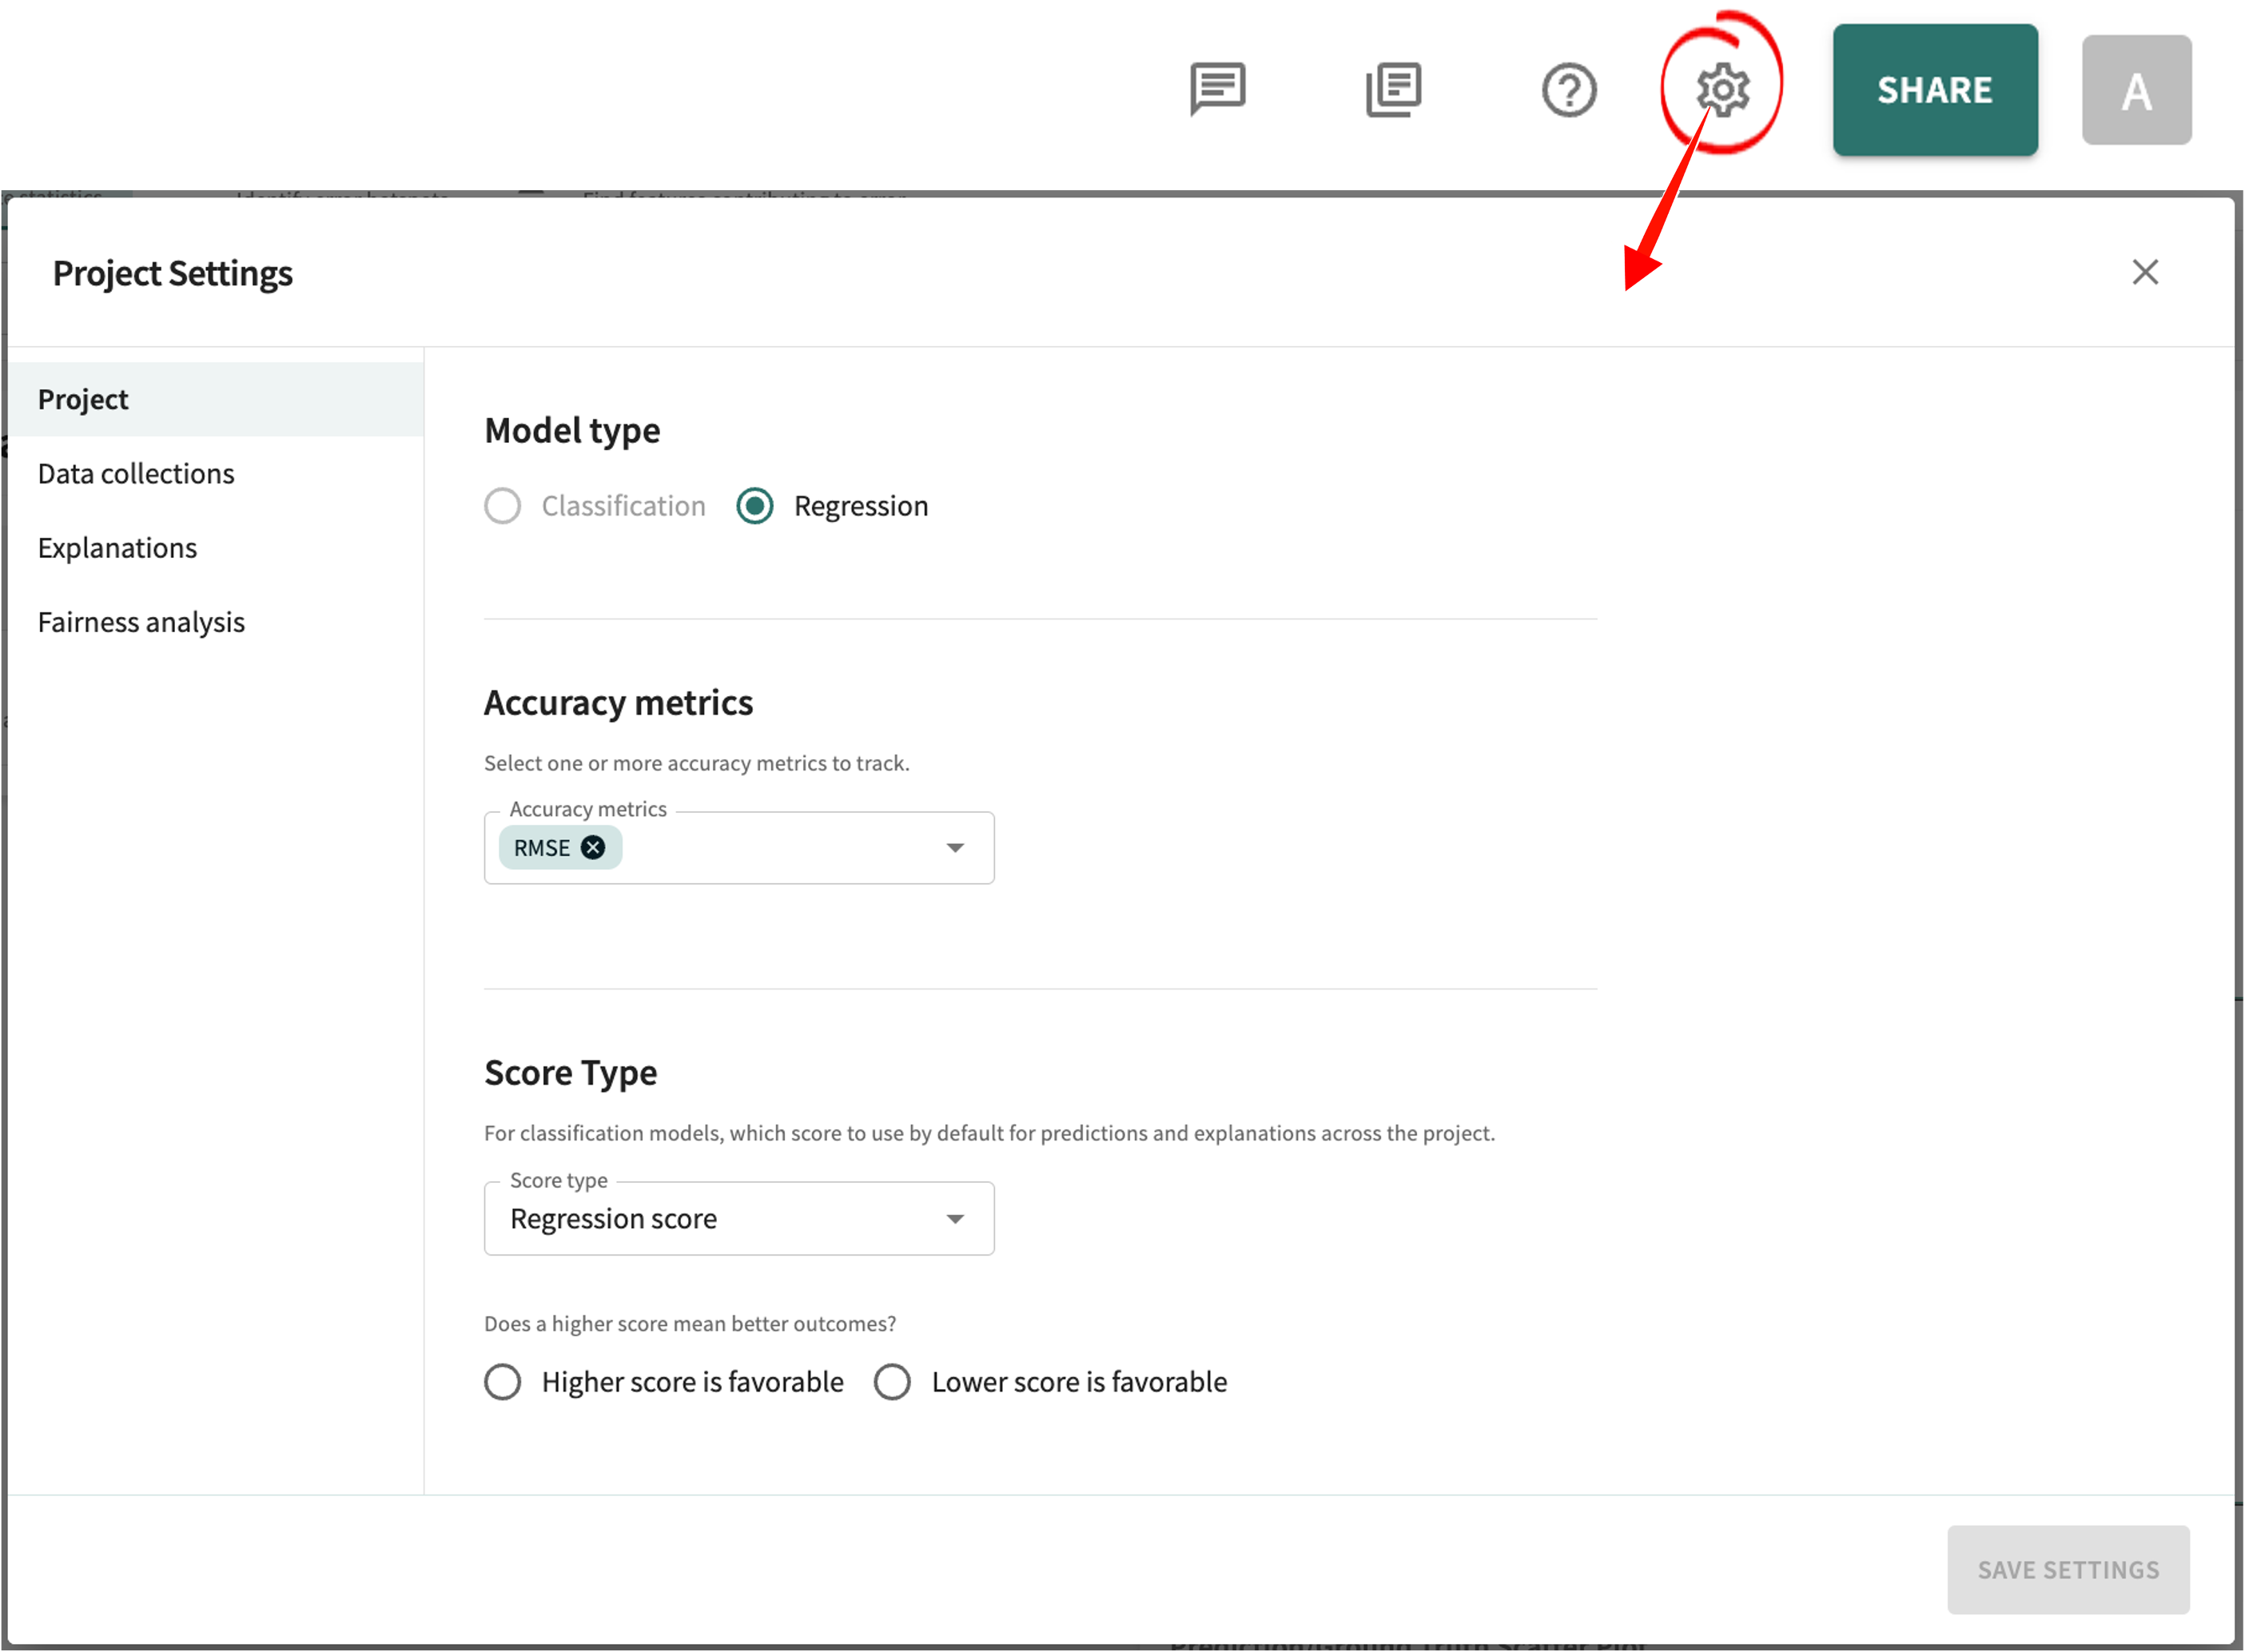
You control all aspects of your project workspace, from model type (
classification
or regression
), the accuracy metric to apply and track, score type (Regression Model
Given the relationship between input and output data from labelled training data, regression models seek to forecast future trends or predict outcomes from unseen input data; can also be used to understand gaps in historic data.Logits
, Logistics Unit
Also known as "log-odds" and from which the term "logistics regression" is derived, represents probability values from 0 to 1 and negative infinity to infinity.Probits
, Classification, Regression), data source, selected data collection and baseline split to use, and the number of influences and inputs to include for explanations.Probit Link Function
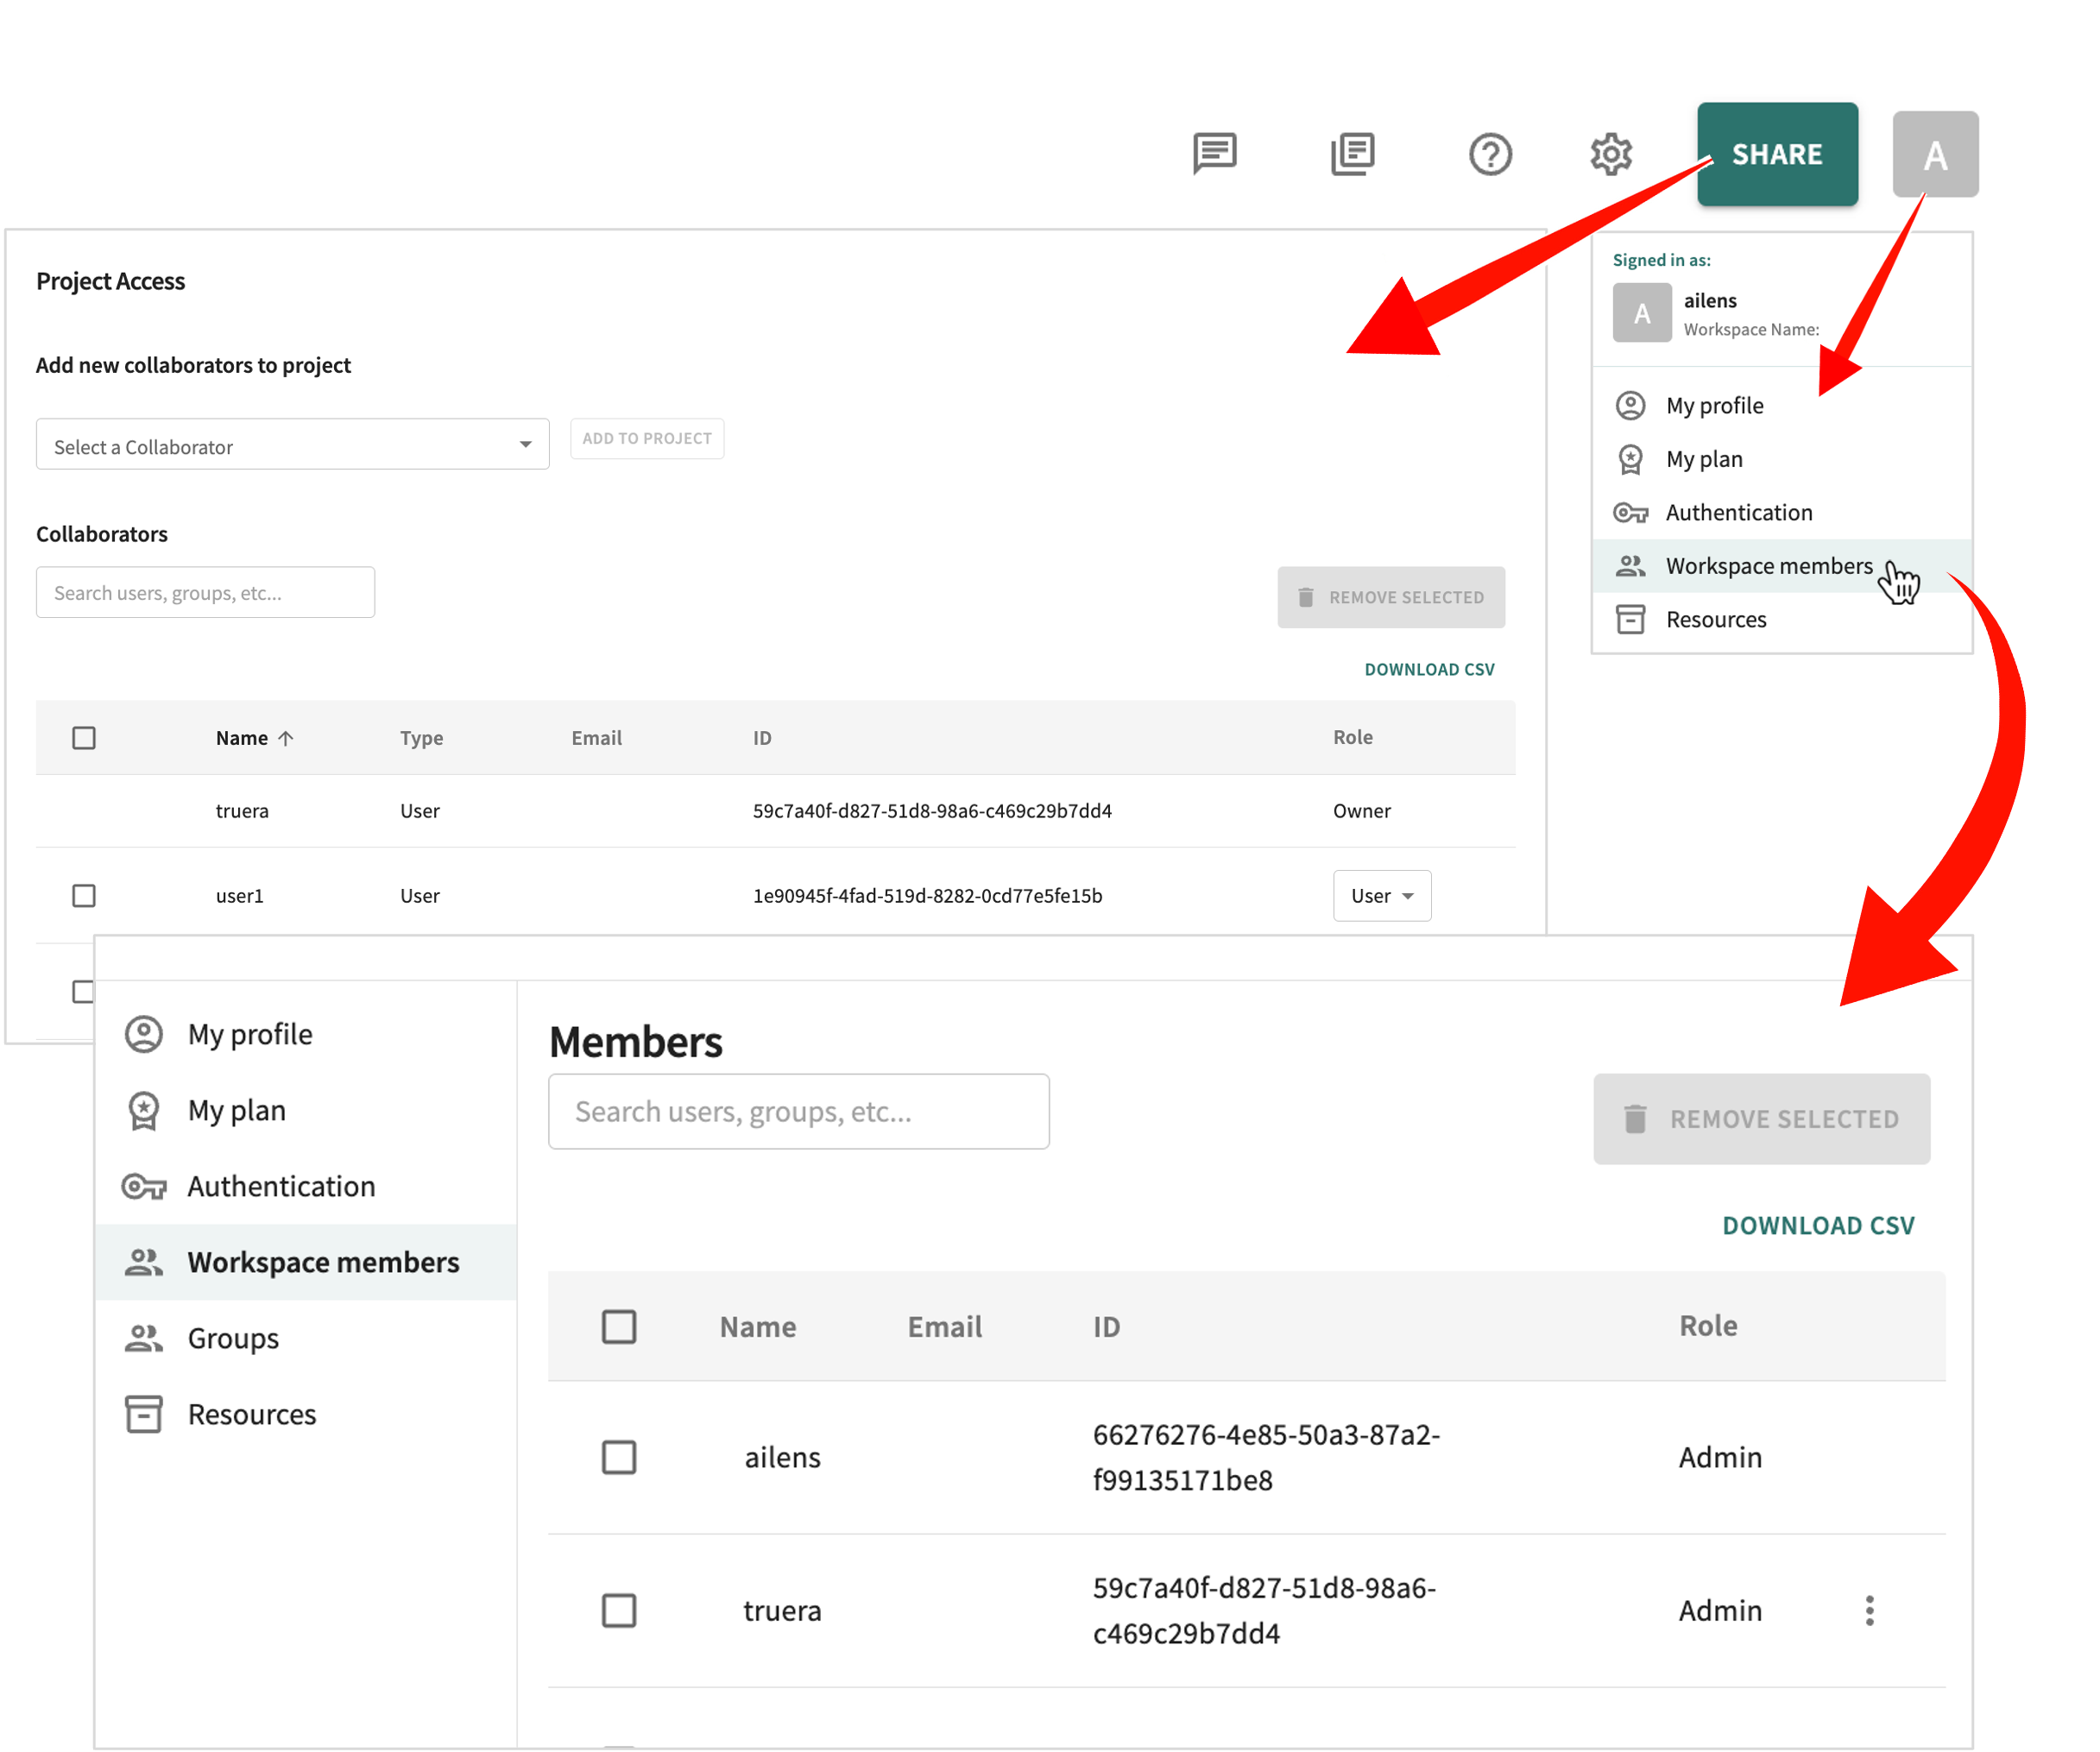
The cumulative standard normal distribution function Φ(⋅) used to model the relationship between the predictors and the probability of the event occurring.Importantly, the TruEra Web App comes with a Workspace members dashboard from which you can add/change/remove a member's role-based access to your TruEra workspace, as well as manage the projects(s) each is permitted to access.
Data Visualization
Supporting both diagnostic and production monitoring capabilities, the Web App drives two types of data visualization:
-
Exploration – to help find a story the data is telling you, and
-
Explanation – to credibly tell the story to an audience (i.e., the consumers of your model's results).
Exploration is the iterative process of scoring various versions of your ingested model with different data splits and segments to visually probe and compare the results (your model's output) in terms of:
- Performance – confusion matrices (predicted outcome vs. actual), accuracy, precision, recall, specificity, F1score,Measures a model's accuracy by combining its precision and recall scores; computes how many times a model made a correct prediction across the entire dataset.precision-recallcurve, and
Precision-Recall
Plot showing the tradeoff between precision and recall for different thresholds. Precision (also called "positive predictive value") is the fraction of relevant instances among the retrieved instances. Recall (also known as "sensitivity") is the fraction of relevant instances that were retrieved.ROC-Receiver Operating Characteristic
A graphical plot that illustrates the diagnostic ability of a binary classifier system as its discrimination threshold is varied.AUCcurve.Area Under the Curve
The area bounded by the curve, the axis, and the boundary points. - Feature importance and influence - how much each feature contributes to the model prediction and which features have the greatest effect on the outcomes of the model.
- Stability – behavior consistency across different distributions of data (e.g., train-and-test vs. OOT).
Out-of-Time Data
Contains data from an entirely different time period than what was used for model development. - Fairness – exposing potential bias in model output.
- Reliability – identifying those datapoints where the model's performance may be unreliable.
You can also create fairess, stability and custom analysis reports and export them for external use.
Meanwhile, explainability is critical to establish/achieve:
- Accountability – knowing the factors that caused a wrong decision/prediction and what is responsible for the failure in order to avoid similar problems in the future.
- Trust – especially in high-risk domains, where relying on decisions made by a machine in lieu of decisions made by human experts can be a touchy situation.
- Compliance – with company policies, industry standards, and government regulations, like Article 14 of the GDPR, for which an enterprise using automated decision-making tools must provide meaningful information about the logic involved.
General Data Protection Regulation
EU law on data protection and privacy in the EU and the European Economic Area. - Control – the ability to rapidly identify and correct flaws in your model; this is contingent upon a comprehensive understanding of your model's decision-making process.
- Optimization – since unless you understand why and how your model works, you won't know precisely what to fine-tune and optimize.
A quick word about semantics
Although often used interchangeably by data scientists, "interpretability" and "explainability" are not necessarily the same thing.
Interpretability is the degree to which a human can readily understand the cause and effect of a decision and consistently predict the model’s result. Explainability has more to do with justifying the model's result; ergo, understanding which features contribute most to the model's prediction and why.
With the foregoing setting the stage, let's next take at look at the Model Leaderboard.
Click Next below to continue.