Influence Sensitivity Plot
Shows the relationship between a feature’s value and its contribution to the model output, or its influence.Fairness
As a matter of quantitative measurement, arriving at a consensus definition of fairness has proven challenging within the AI/ML community. In general, however, a model exhibits bias if its decisions result in a protected group being treated unfavorably for reasons that are not justifiable.
TruEra's Fairness diagnostic identifies potential bias in model output and provides the analytical and reporting mechanisms to help you determine if the bias found is justified or not.
Governing Definitions
TruEra's fairness framework is governed by these terms and definitions:
Protected Group
A protected group identifies a subset of the population. Often it refers to a subset that has been historically disadvantaged in that jurisdiction based on gender, race, or other characteristics, and is therefore protected. The set of protected groups will typically vary from one regulatory regime to another. TruEra lets you choose how to define this segment.
Compare Group
A compare group identifies a subset of the population to which the protected group is being compared. By default, it refers to the rest of the population (excluding the protected group), although you can also select a specific segment of the population. For example, in one case, you might want to analyze the impact of the model on women (a protected group) as compared to the rest of the population (the compare group). In another case, you might choose to analyze the impact the model has on a people living in Delhi (protected group) compared to people living in Mumbai (compare group).
Unfavorable Treatment
Informally, a protected group (e.g. women) is treated unfavorably relative to its compare group (e.g. men) if the model’s outputs are “significantly worse” for the protected group. This situation is also referred to as Group Disparity, measuring the Disparate Impact Ratio. The standard for “significantly worse” will vary by jurisdiction. As one example, in the US, the 80% rule (meaning the protected group gets favorable decisions at less than 80% of the rate for the complement group; 80% is therefore Disparate Impact Ratio) has become the standard for “significantly worse” for employment-related unjust unfairness assessment.
Reasons for Fairness
If a model treats a protected group unfavorably, the next step is to determine what features (or combinations of features) caused the unfairness.
Direct Use
If a protected feature directly used by the model (e.g., gender) causes the unfavorable treatment, this may be viewed as problematic in certain jurisdictions (e.g., in the US it is called "disparate treatment").
Indirect or Proxy Use
Even if the protected feature is not directly supplied as a feature to the model, it may end up using a “proxy” (an associated feature or feature group) that causes the unfavorable treatment.
Assessing Fairness: The Overview
Click Fairness in the menu. The Fairness overview tab opens by default.
First things first
Before you can designate Protected Segments for your model, you will first need to define the segments. The guidance included next will help you in that endeavor. See also Creating and Managing Segments for more on creating protected segments.
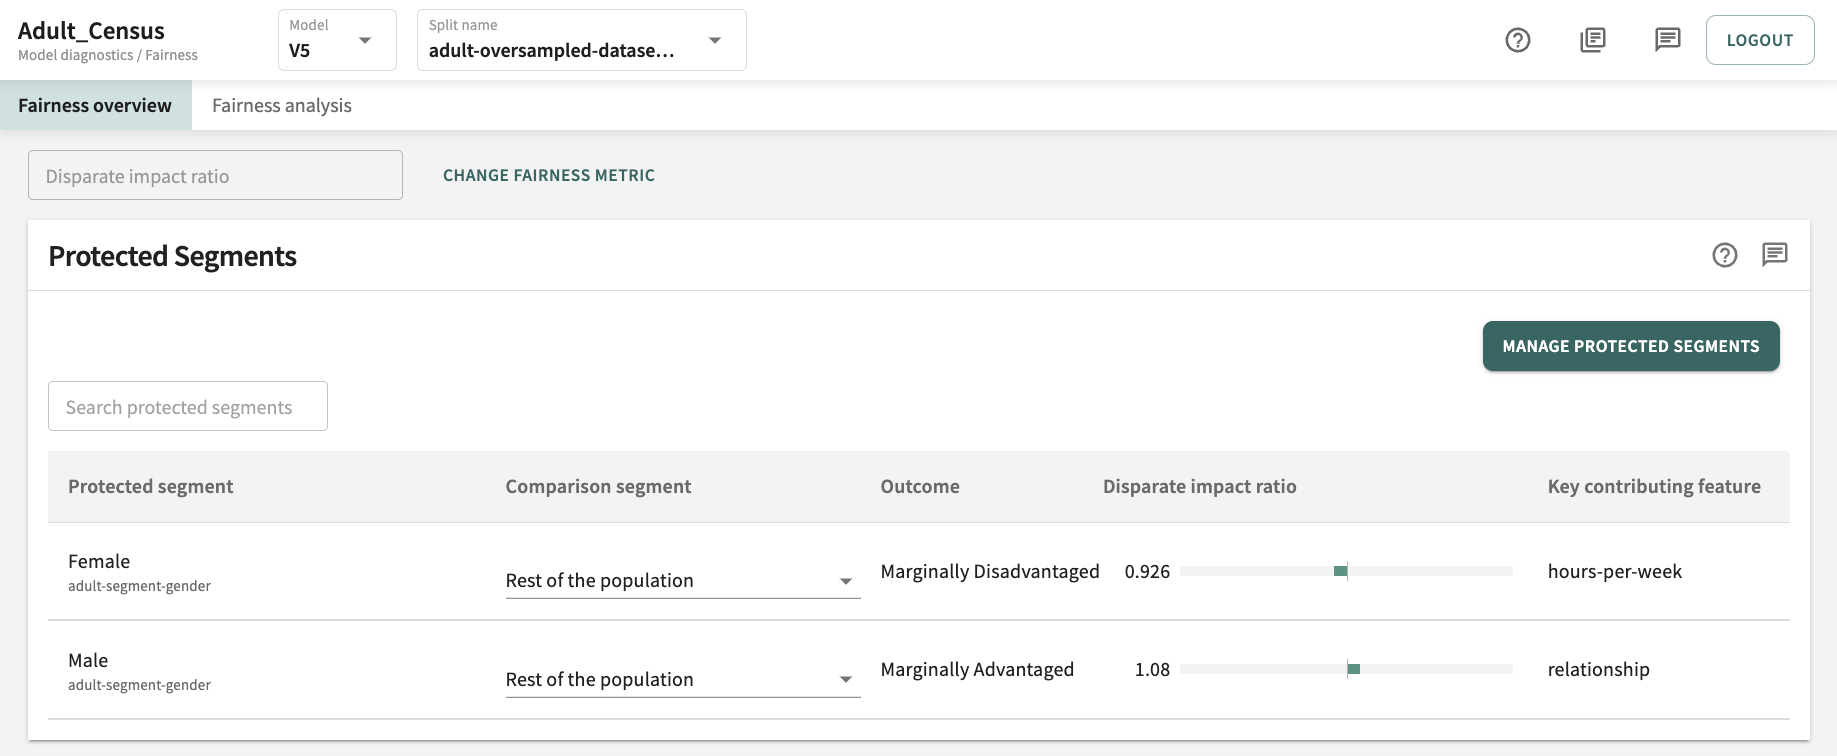
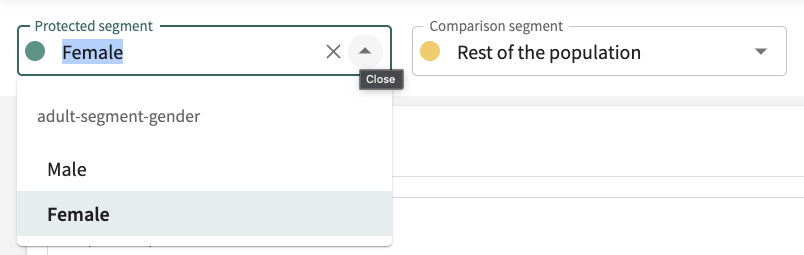
If you have already designated protected segments for this model and split, the list of Protected Segments is displayed and you have the option to change the Comparison segment.
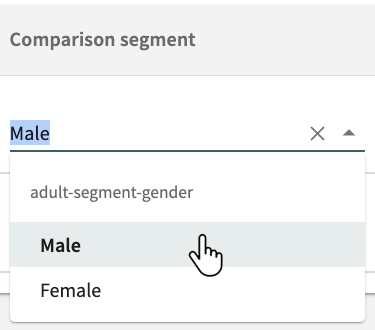
By default, the comparison is Rest of the population. To change it, click the Comparison segment drop-down adjacent to the desired Protected segment and select an available segment.
Click X to revert to Rest of the population.
From here, you can also:
- Manage your protected segments
- Create new segment groups and add segments
- Change the fairness metric.
Each option is covered next, in turn.
Managing Protected Segments
With the Fairness overview tab open, click MANAGE PROTECTED SEGMENTS to define and designate protected segments.
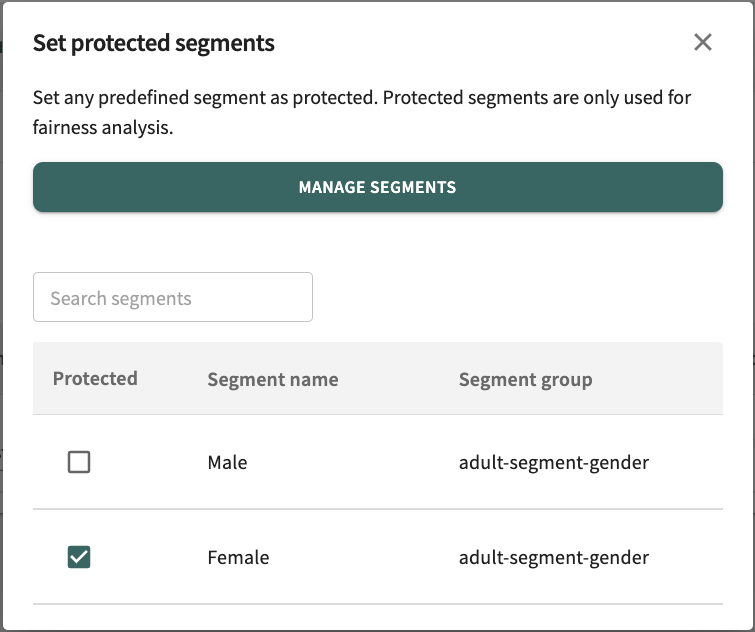
Click a Protected checkbox to enable/disable protection of a segment. If you have a substantial list of defined segments, click in the Search segments textbox and enter a partial or full Segment name to look for the closest match. Click X to return to the Fairness overview tab.
If you want to edit/delete a segment or add new segments for which you can then set protection, click MANAGE SEGMENTS.
Creating New Segment Groups and Adding Segments
See Creating and Managing Segments for guidance on creating segment groups and editing, deleting, and adding segments.
Changing the Fairness Metric
With the Fairness overview tab open, the fairness metric currently under evaluation appears directly below the Fairness overview tab. This evaluation helps you identify unjust bias toward protected segments and locate features that are contributing to those results. The selected fairness metric defines the protected segments you want to evaluate.
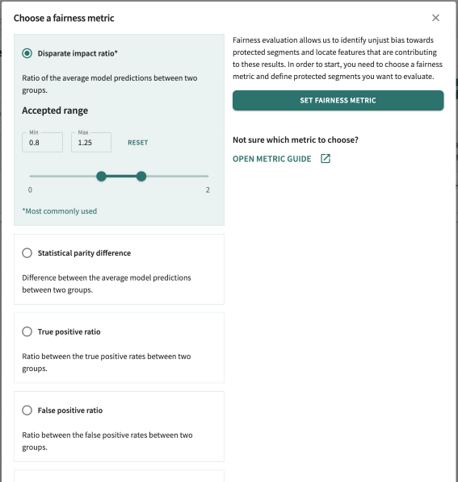
To change it, click CHANGE FAIRNESS METRIC and set the Accepted range (min-max). See Supported Metrics.
Click RESET to revert the range. Click SET FAIRNESS METRIC to enable your choice and range for fairness evaluation.
After selecting the fairness metric and now having seen a preview of the protected segment scores, we can zoom into specific segment comparisons by opening the Fairness analysis tab.
Assessing Fairness: The Analysis
As any data scientist will tell you, training and evaluation of "fair" classifiers is challenging, in part because most fairness metrics of interest depend on both the "sensitive" attribute information and the label information of the data points. In many scenarios, it's just not possible to collect large enough datasets with this information. Hence, it becomes increasingly important to audit and interpret the output decisions of models for fairness in the early stages of development and evaluation.
Still, does merely excluding protected attributes always avoid discrimination?
We're mostly talking about demographics such as sex, race, ethnic or social origin, genetic features, language, religion or belief, political opinion, disability, age, sexual orientation, and so forth. Simply eliminating these characteristics from the analysis isn't the answer. That's because an algorithm trained with geographic data will inevitably use proxy relationships to make decisions about group membership.
A holistic view of both data and learning model governance is key. And TruEra brings it!
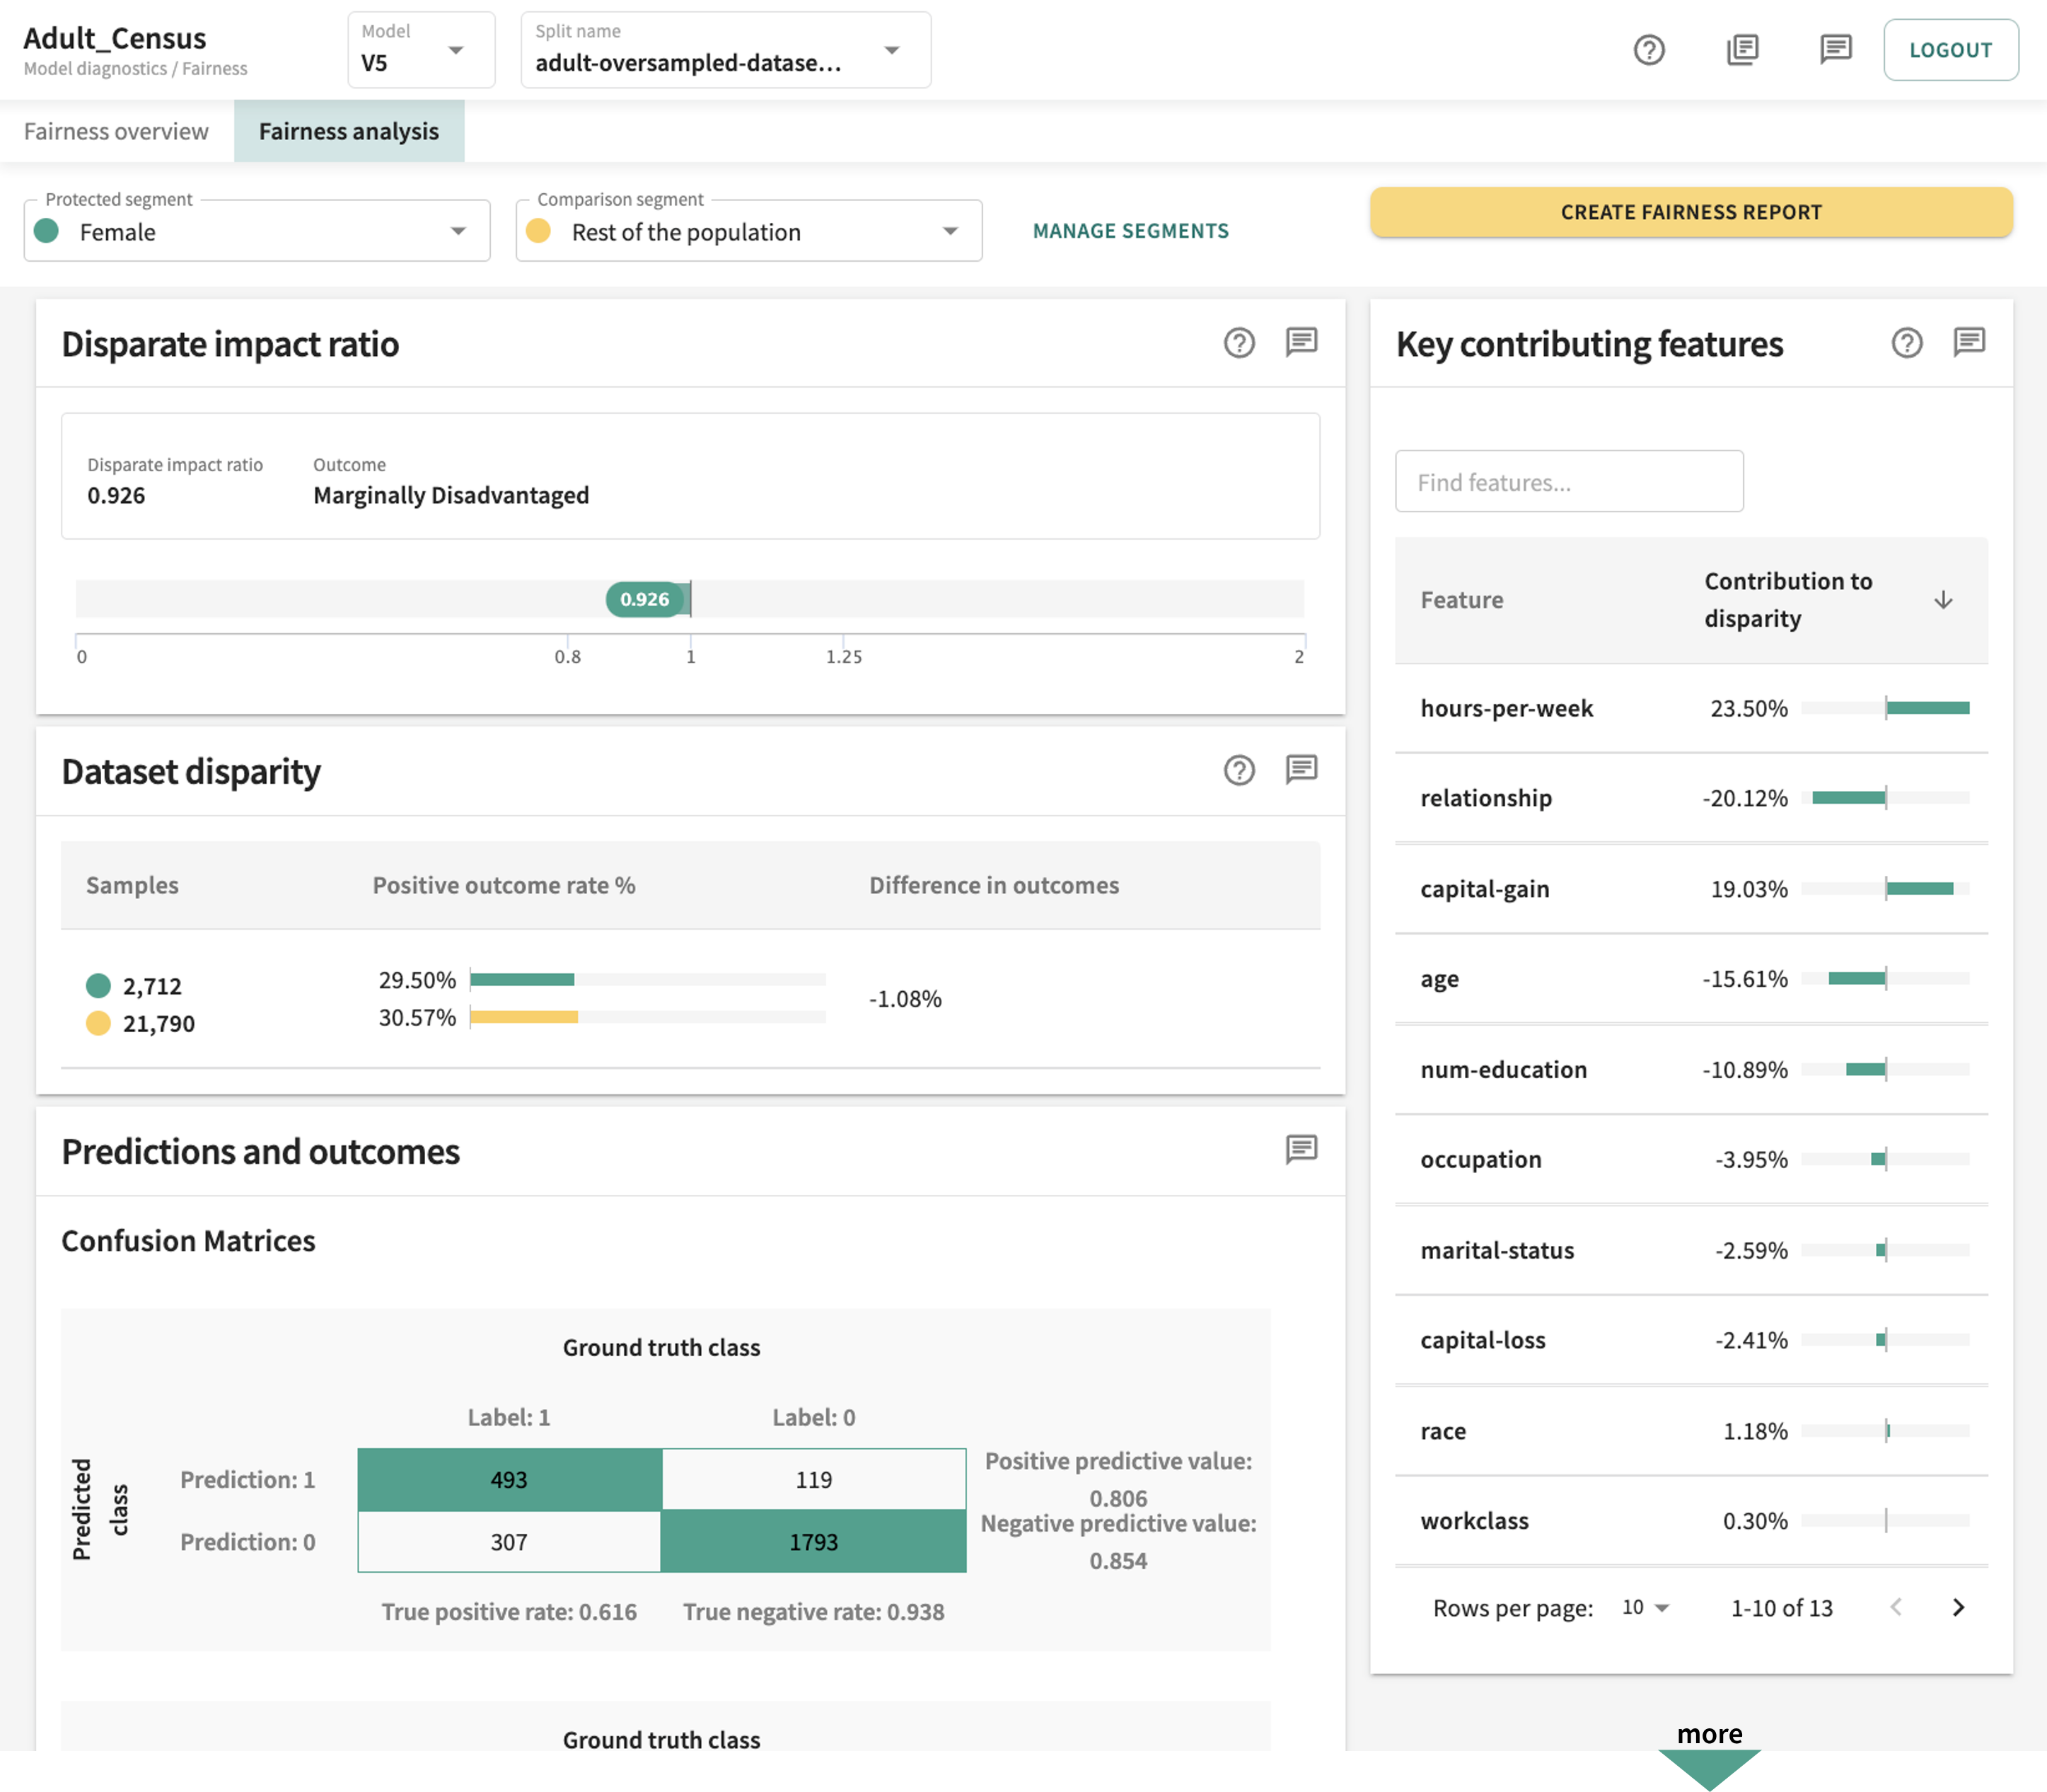
The top of the Failure analysis dashboard identifies the currently set Protected segment and Comparison segment
.
You can change these by clicking the respective drop-down and choosing a different segment. Revert by clicking X. But you must select a Protected segment to conduct the fairness analysis.
If no Protected segment has been selected, you'll be prompted to do so.
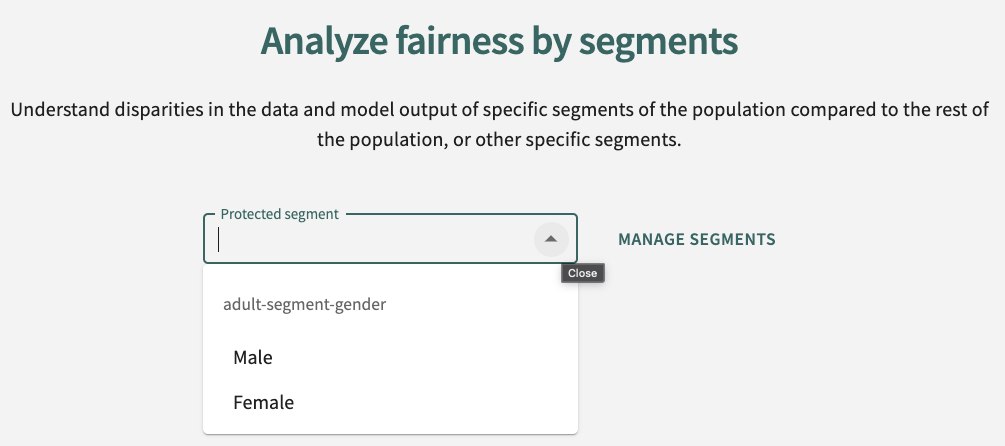
Click in the Protected segment drop-down and choose a segment or click MANAGE SEGMENTS to define a segment to protect. See Creating and Managing Segments for guidance on creating segment groups and editing, deleting, and adding segments.
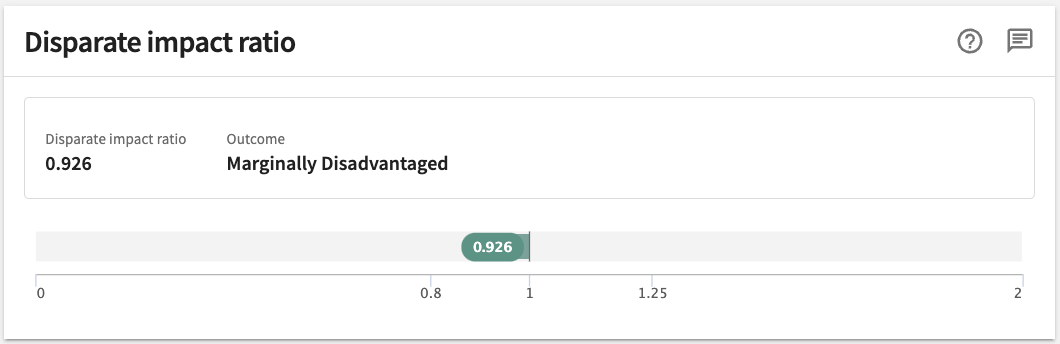
Once you have designated a Protected segment and a Comparison segment, the fairness metric you chose in Fairness overview is applied.
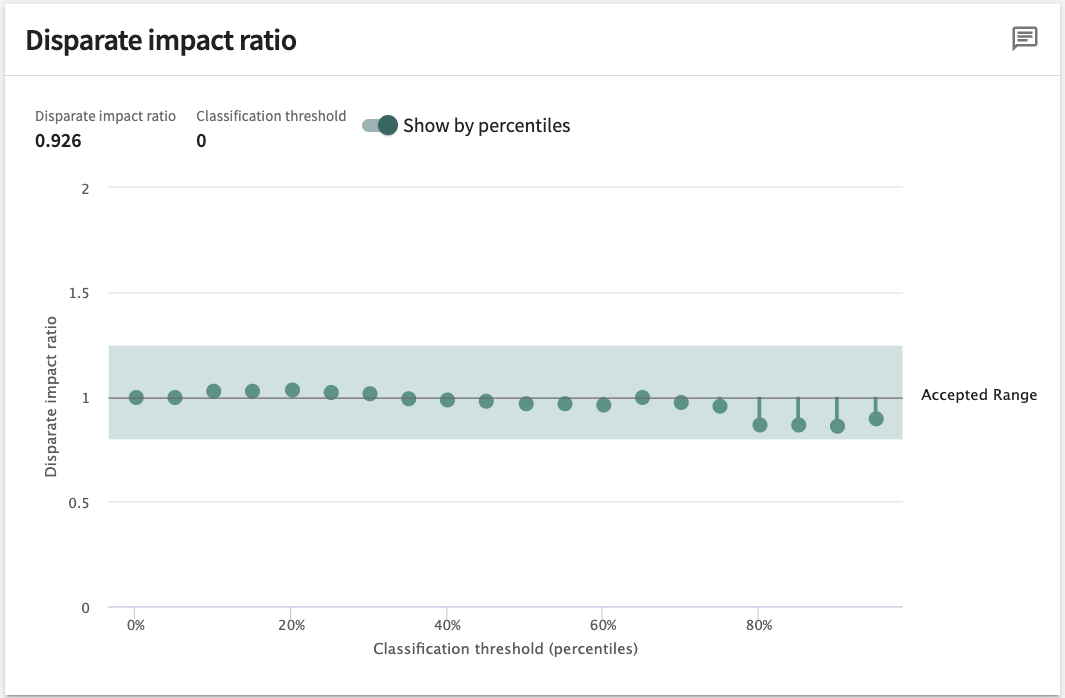
As an example (pictured below), if the Disparate impact ratio produced by a model for the protected group is 0.926 — within the accepted range of 0.8 - 1.25 but definitely on the low side — it tells us the protected segment is marginally (i.e., somewhat) disadvantaged.
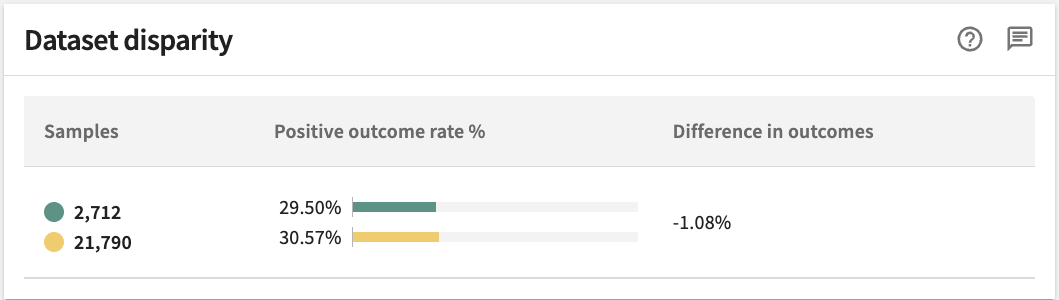
Dataset Disparity
To identify and address unjust bias, it's important to understand whether the dataset disparity falls within the ground truth values of your data splits. TruEra lets you compare the ground truth rates of your bias and the rest of the population (or a specific comparison group). A large disparity suggests your data could be the source of unjust bias, not the model itself. A Positive outcome rate is the percentage of rows with a ground truth value of one. The Difference in outcomes is the difference between the positive ground truth rate of the bias group and the positive ground truth rate of the rest of the population (or a specific comparison group). The Samples column indicates the population of each group.
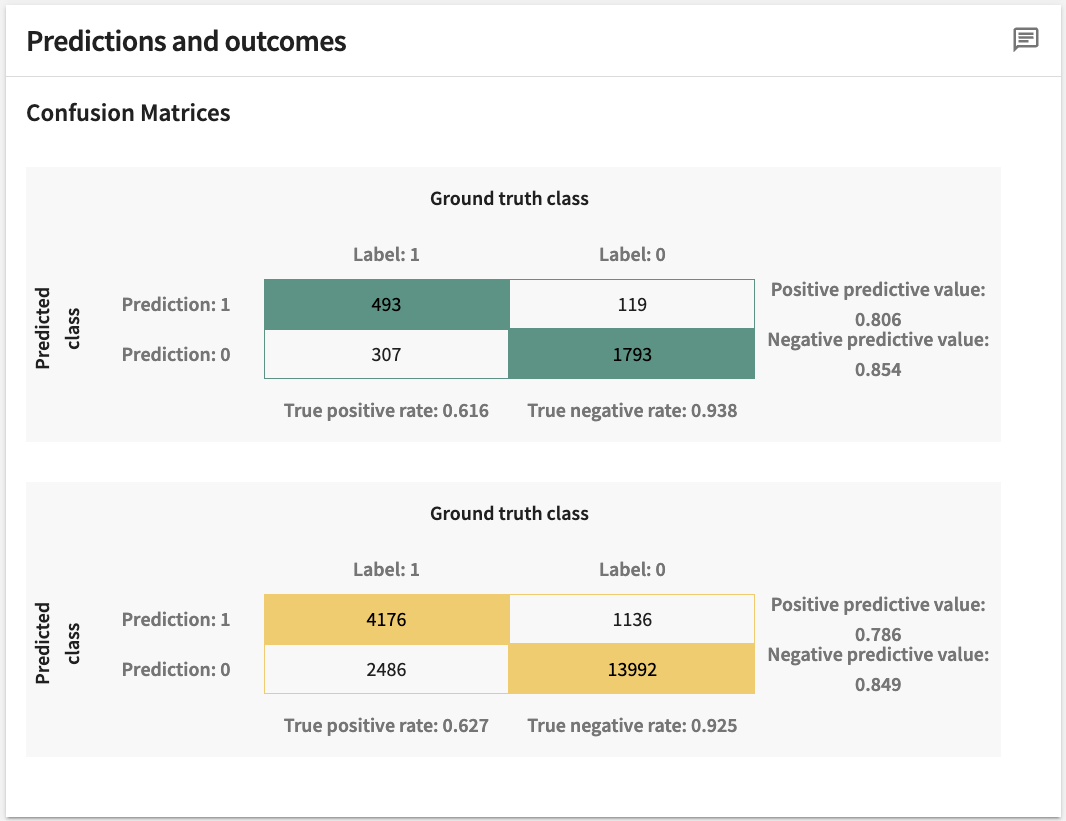
Prediction
Predictions pertain to classification models with ground truth labels only.
Presented in Confusion Matrices supplemented by supporting metrics where appropriate, Predictions and outcomes provide a comparison of model predictions against ground truth labels.
Model Score Disparity
This panel demonstrates the difference in model scores for the protected segment against the comparison segment, by highlighting the differences in the means of the model scores via bar graphs and applicable model score difference metrics. In the example below, these are:
- Wasserstein Distance (WS) – the 1st Wasserstein Distance (aka the Earth Mover Distance) between the model score distributions for the two groups. A higher value here means a larger disparity between the protected and compare group.
- Mean Difference – the difference between the means of model scores for the protected group and its complement. In the example, the model’s mean score for women is less than its mean score for the rest of the population. Since higher scores are better for this model, the metric indicates unfavorable treatment of women.
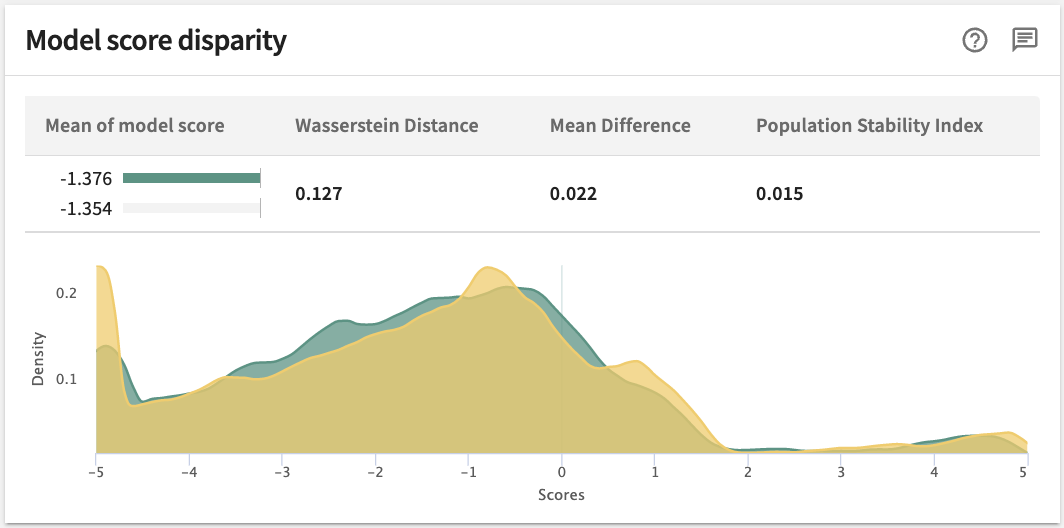
Model score distributions for the protected group and the compare group plotted at the bottom of the panel assist in a qualitative understanding of group disparity; i.e., Disparate Impact Ratio. In the example, the distribution for the rest of the population (colored in yellow), is slightly to the right of the distribution of scores for women (in green), indicating that the model treats men somewhat more favorably than women.
The population stability index (PSI) is a widely used statistic that measures how much a variable has shifted over time. A high PSI may indicate a change in the characteristics of a population, a shift requiring investigation and a possible model update.
Classification Threshold
This is the score threshold for which the classification of a particular instance goes from positive to negative or vice versa. Scanning across the entire potential range of classification thresholds you're able to see how the model might impact the protected and comparison classes differently at different thresholds. You can then compare the fairness metric across these user-specified thresholds represented by the Scores axis.
The chart (see example below) plots the change in fairness metric on the y-axis with the classification threshold on the x-axis. The highlighted band covers the user-set accepted range — the range of values where disparities are considered acceptable. This chart can be used to identify ranges of thresholds for which the fairness metric falls within acceptable ranges.
Tip
Click the Show by percentiles toggle switch to change the scale between Logits score and percentiles.
With respect to regulatory compliance, while each use case and jurisdiction should be evaluated on a case-by-case basis, US labor law generally recognizes the “four-fifths” threshold to identify cases of adverse impact.
Feature Contribution to Disparity
Under the Fairness analysis tab, the panel on the right labelled Key contributing features will aid you in determining which features contributed most significantly to protected group disparity. Sorted by Contribution to disparity in terms of either absolute value or actual value (high to low or vice-versa), you can change the sort order by clicking the toggle arrow to make your selection. If the features in your dataset are extensive, you can search for a match by clicking in the Find features... field and entering a partial or full search string.
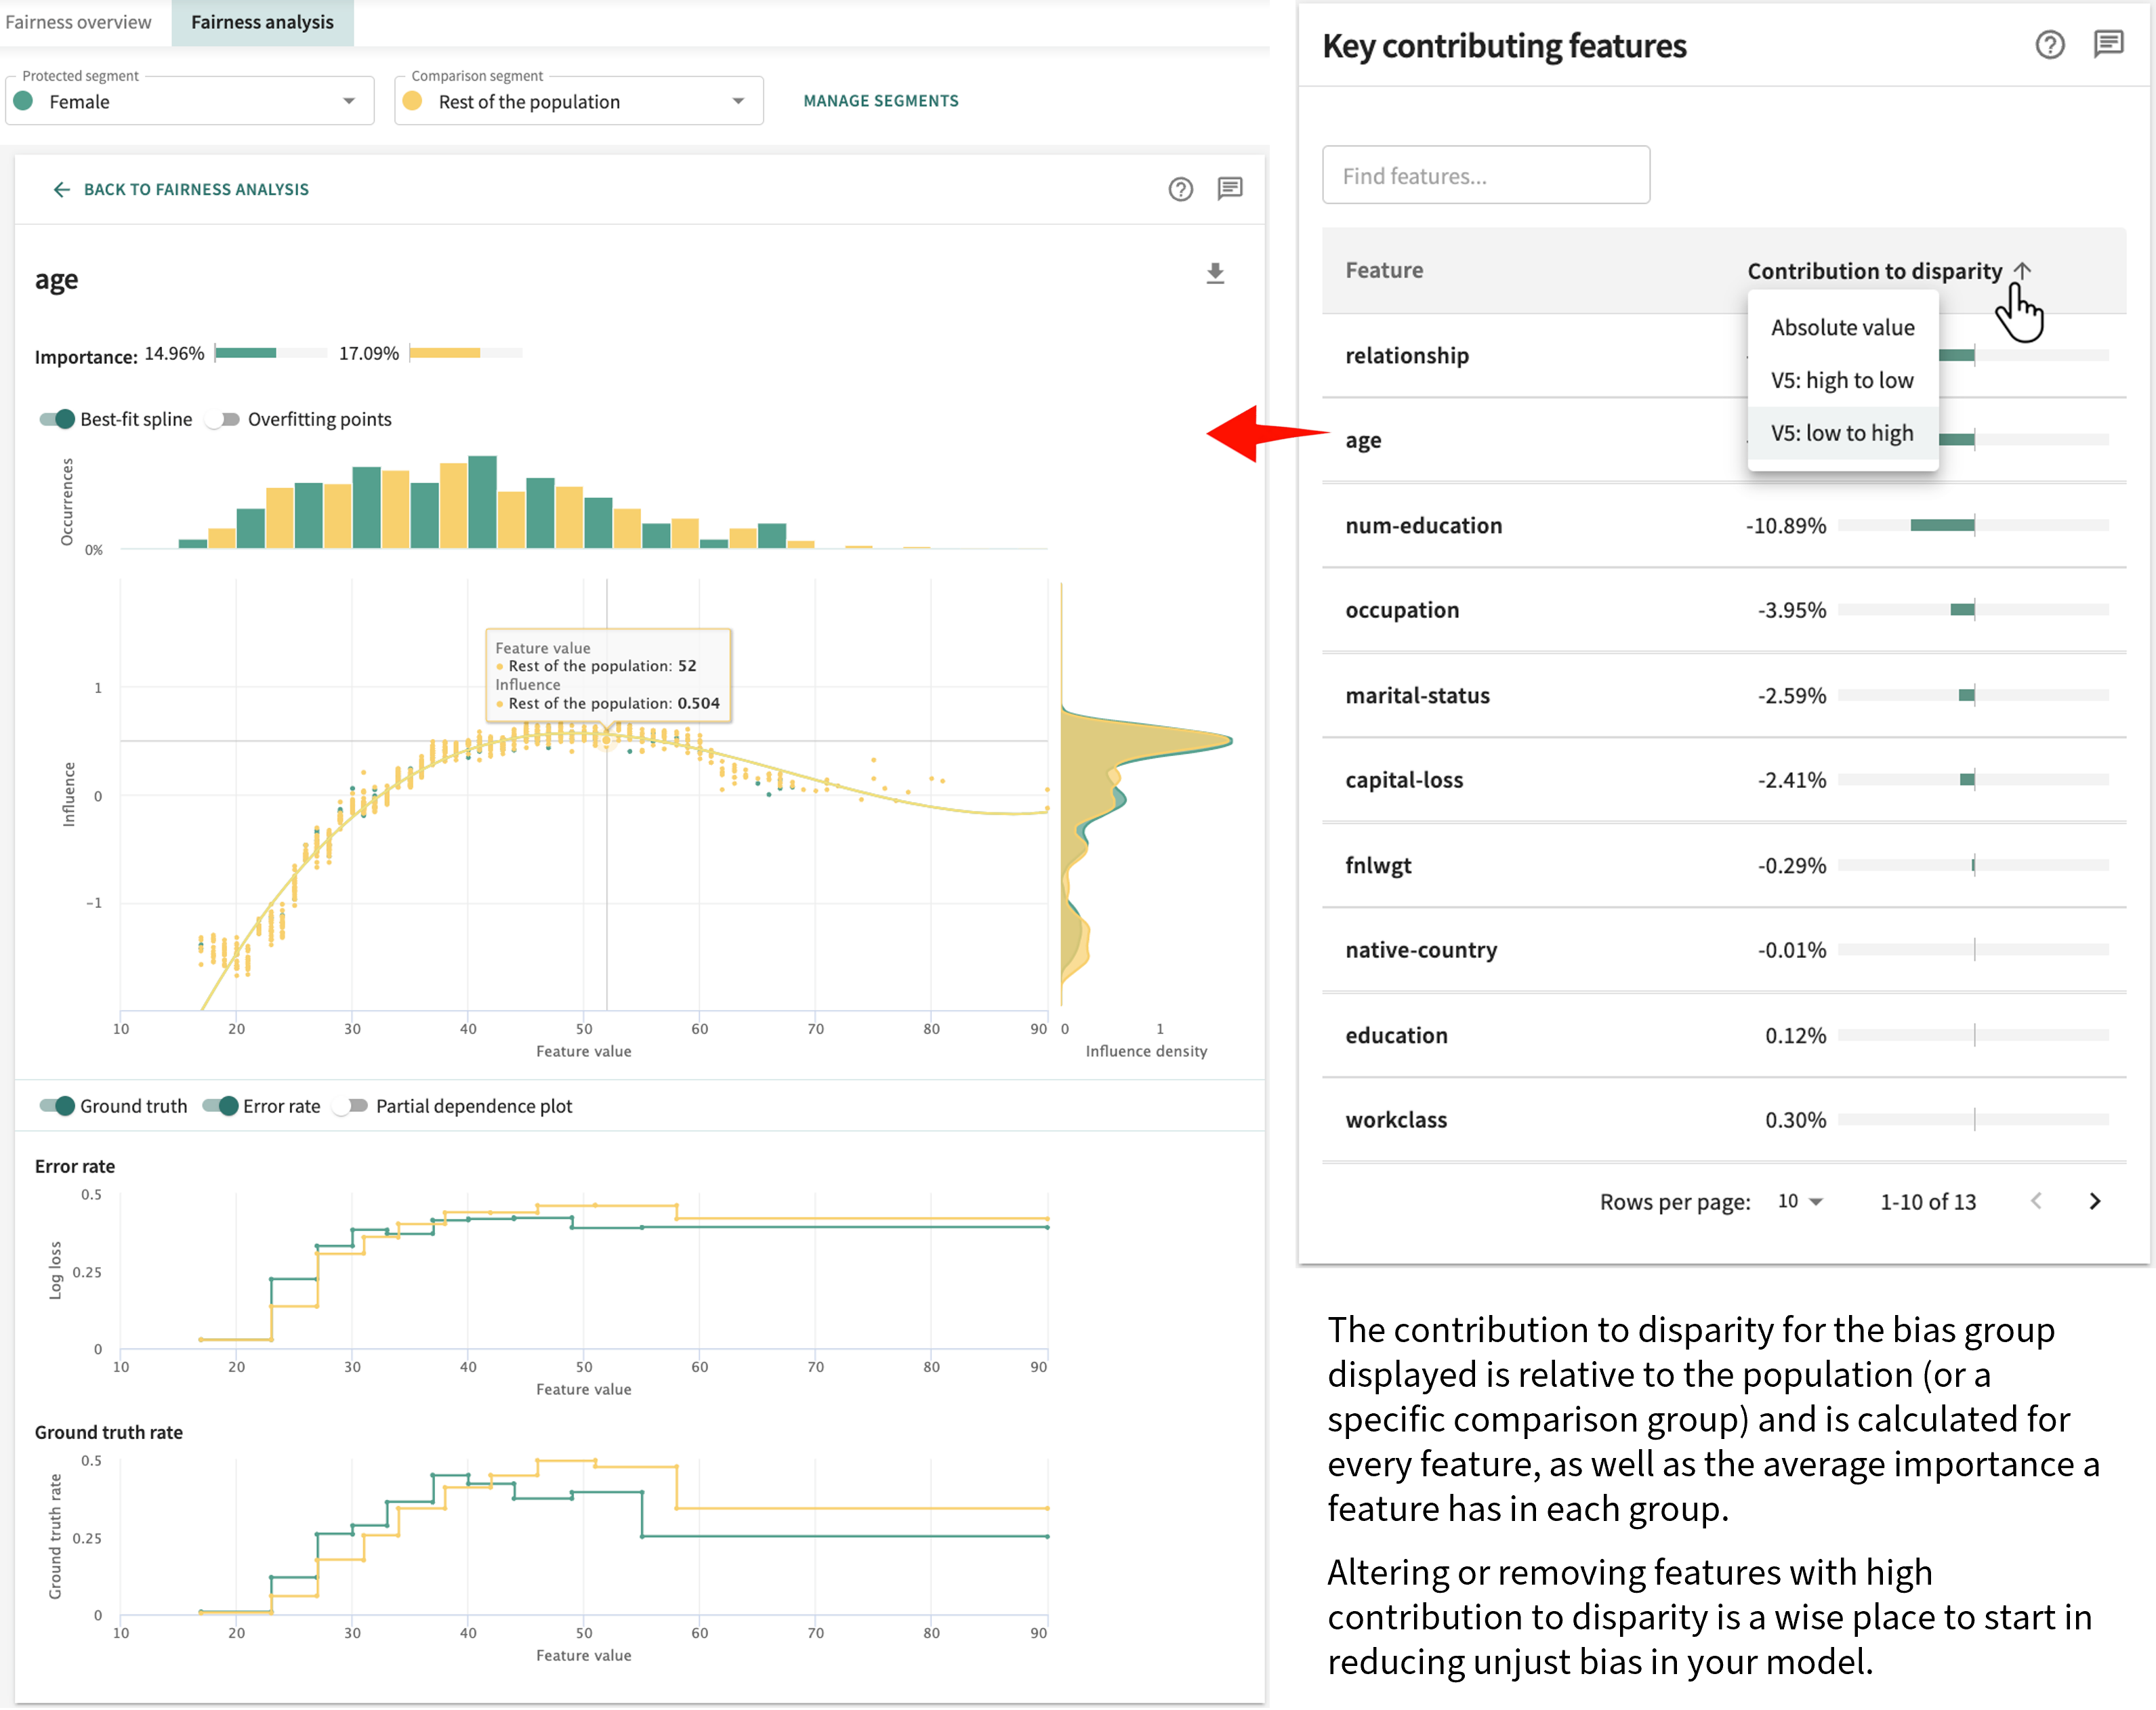
In addition to its importance score, the details for each feature include an
ISP
, also known as the feature's influence, shows the relationship between the feature’s value and its contribution to the model's segment group output. Overlaid to contextualize the ISP by showing particularly sparse or dense regions is a distribution of the feature values (shown at the top) and the distribution of influences (shown on the right). For more on ISPs, including advanced features like the ISP best-fit splines and overfitting points diagnostics, see [Influence Sensitivity Plots](features.md#influence-sensitivity-plots).Use this analysis to help determine what adjustments, if any, need to be made to your model and dataset to mitigate unjustifiable bias.
Creating a Fairness Report
The need for apprising stakeholders on the fairness of your model goes hand-in-hand with its explainability. Indeed, regulatory governance demands it. But not every stakeholder or potential contributor will have direct access to the TruEra Platform and your team's real-time resources. Regardless, TruEra has you covered so you can share your model's fairness results with those of your choosing.
Consistent with the TruEra-generated fairness analysis described above, you can at any time create a Fairness Report containing the results for the selected Protected group vs. the Compare group that can include your notes, comments and insights for each report section.
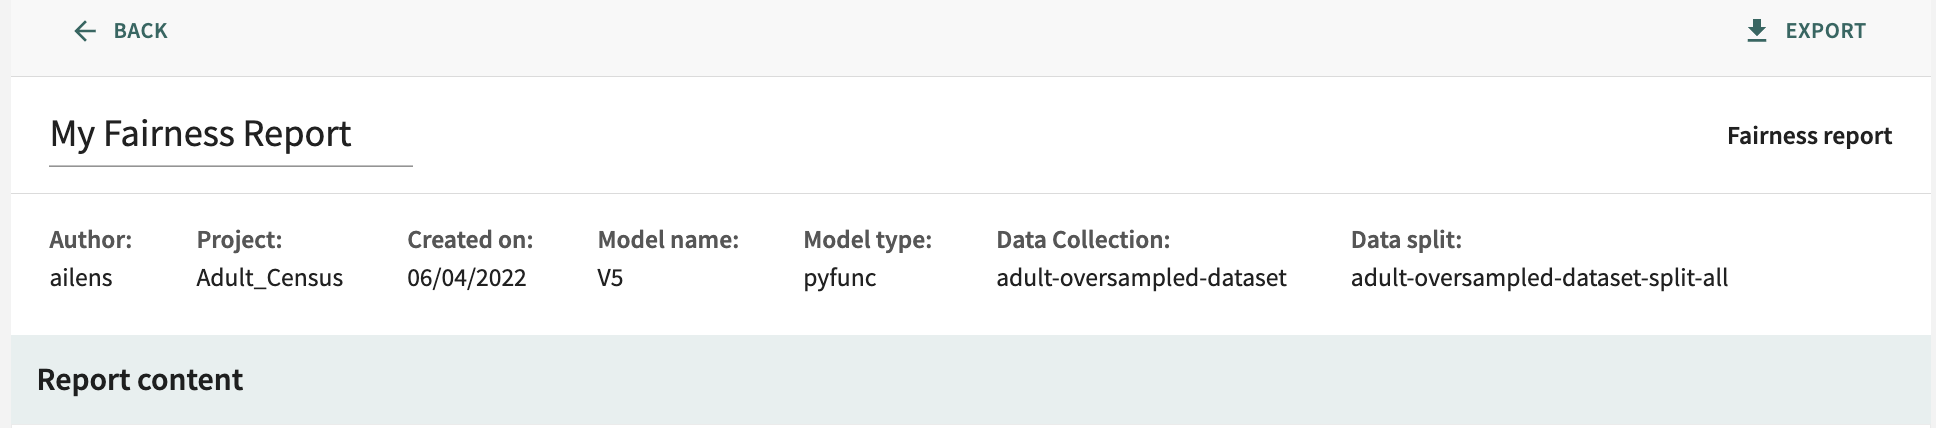
Headed with the report title and parameters (Author, Project, Model name, Model type, Data Collection, and Data split), the report contains a content explanation and Summary. Depending on the model — classification or regression — additional report sections can include:
- Fairness metric
- Dataset disparity
- Predictions and outcomes
- Model score disparity
- Classification threshold
- Key contributing features
- Assessment of protected segment – provided by you, this is your team's expert analysis and conclusions on the justifiability of the fairness results and your recommended steps to mitigate any measured bias found.
Click CREATE FAIRNESS REPORT directly above the Key contributing features panel to generate a report for the protected group currently set.
Much of the required form displayed is pre-populated with your currently selected Model, Base split, Protected group, and Compare segment. You will need to enter a Report name. Here, also, you can link to Project settings to add/change the Score interpretation and/or Fairness metric before report generation.
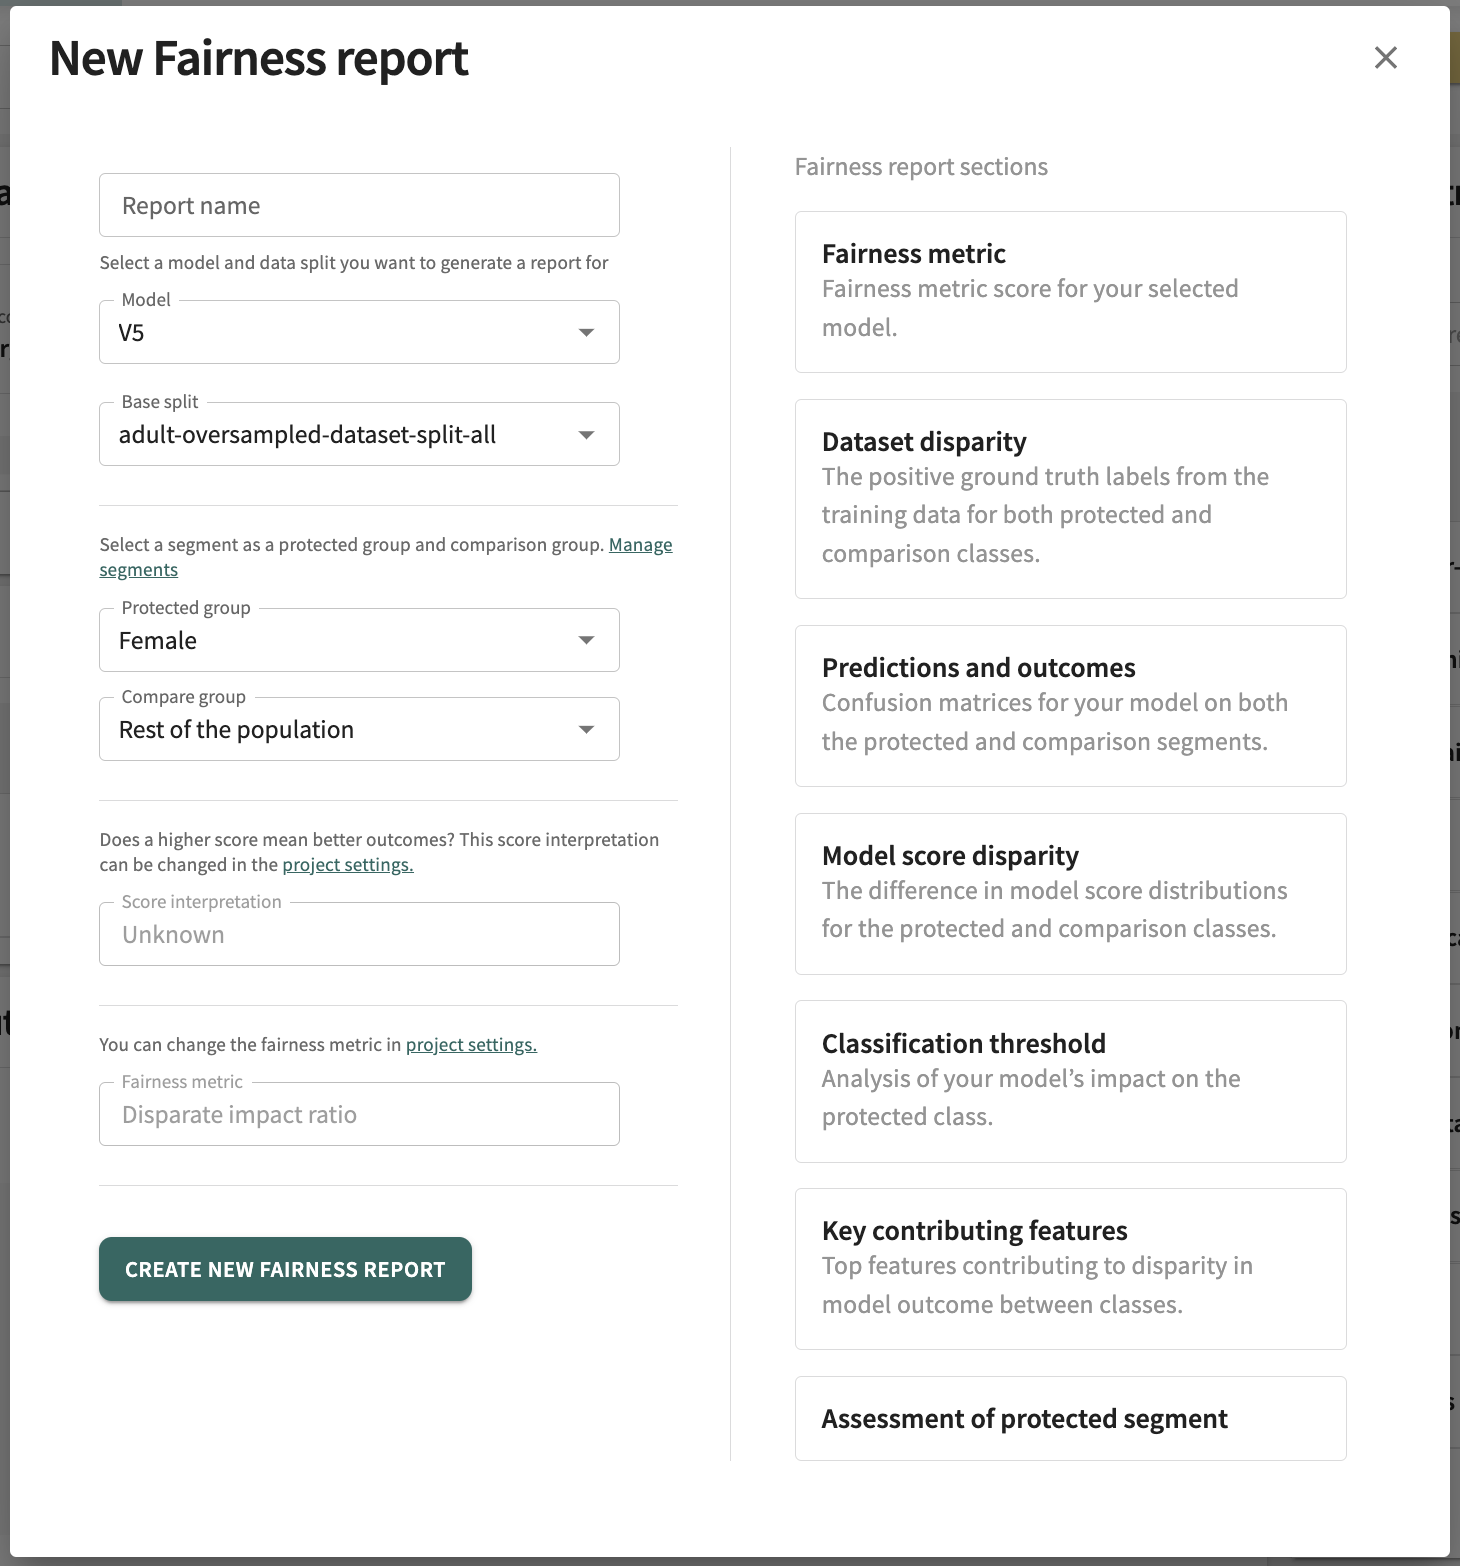
Click CREATE NEW FAIRNESS REPORT on the bottom-right of the form to generate the report.
Each report section provides a plaintext input field to enter notes. Simply click in a Notes field to add remarks.

Later, after exporting the report, you can edit/modify these comments and other report content, as desired, in any rich text application that supports the .docx format.
To export the report, click Export in the top right of the generated report.
Click Next below to continue.