Creating/Changing a Dashboard
Sign-in at http://app.truera.net, then make sure the MONITORING tab is open. If it isn't, click it.
Right off the bat, your list of Dashboards is displayed (if you're creating your first dashboard, the list will be empty).
Here's the information you'll need at hand, along with the setup decisions you'll need to make, when creating your new dashboard:
- Basic identifying information – name, description, who created it, default time behavior (default time window, time granularity of the dashboard), and how often to auto-refresh the dashboard.
- Model(s) to include – choose the models in selected projects to track, then select the baseline splits to use for drift calculations (typically the training split but can be a known good production time window).
- Panels to configure – select which metrics to display in the dashboard, organized as follows:
— Model Output – output statistics, trends, drift (requires baseline data), and performance (requires labels)
Model Input – volume trends, drift, and drift quality metrics
— Custom data – for custom metrics (see Ingesting Custom Metrics) and/or segment tag performance see [guidance not yet available]
After initial dashboard creation, you can make changes/additions in accordance with the guidance presented below.
Navigating Your Dashboards
As pictured above, select a dashboard by clicking its row. You can also search for a particular dashboard by entering either a partial or full Dashboard Name. Click the icon in the last column on the right to edit or delete a respective dashboard. Change the number of dashboards to display per page at the bottom of the page. Go back to the previous page or move to the next page by clicking the or icon, respectively.
See Panel Organization for more on the arrangement of dashboard panels).
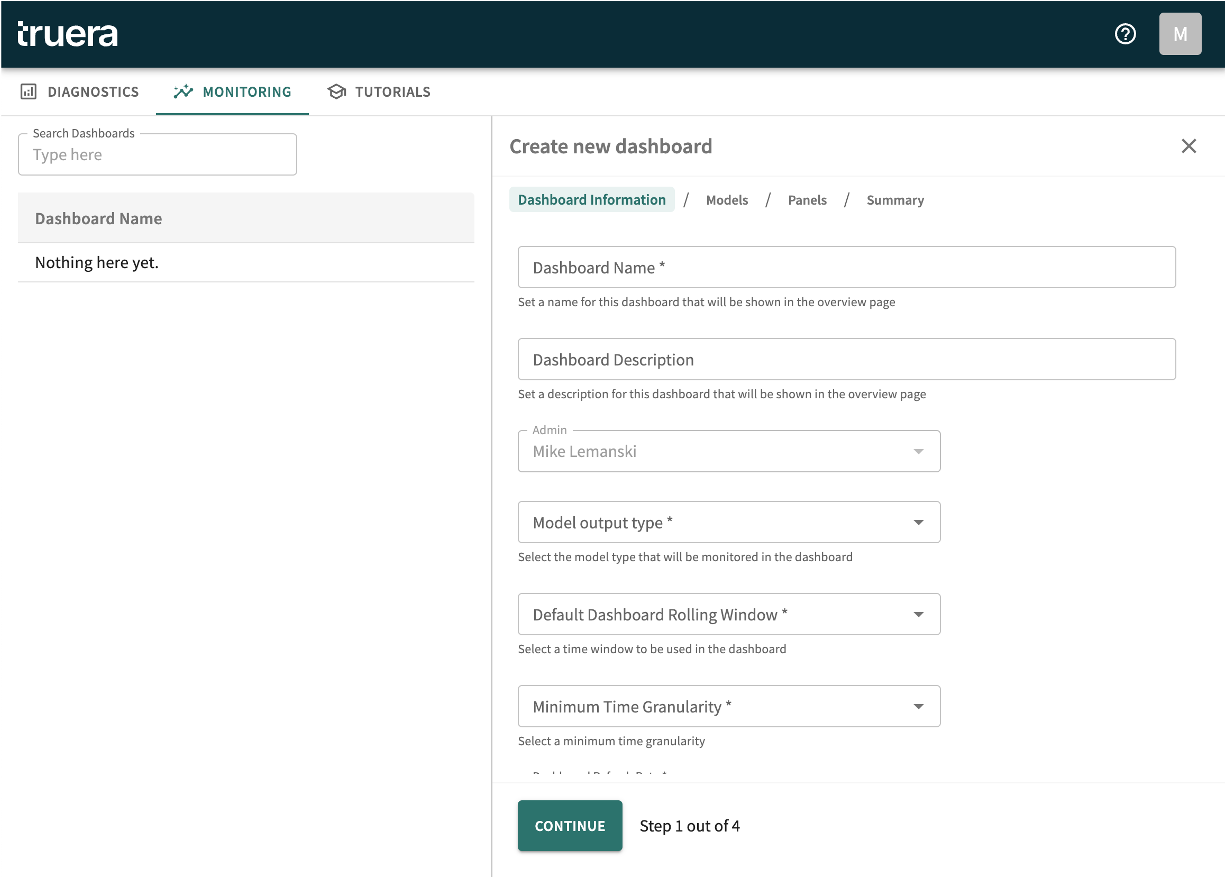
Click CREATE NEW DASHBOARD to get started. When you do, you'll see a split screen. The panel on the left lists your existing dashboards, if any. The panel on the right is where you configure your New Monitoring Dashboard.
Step 1. Enter Dashboard Information
As pictured below, you first need to identify the dashboard and its general purpose, model output type, refresh rate (update frequency), time granularity (period used to aggregate values together for display), and a default rolling window (time period over which performance is measured).
To complete this step, do the following:
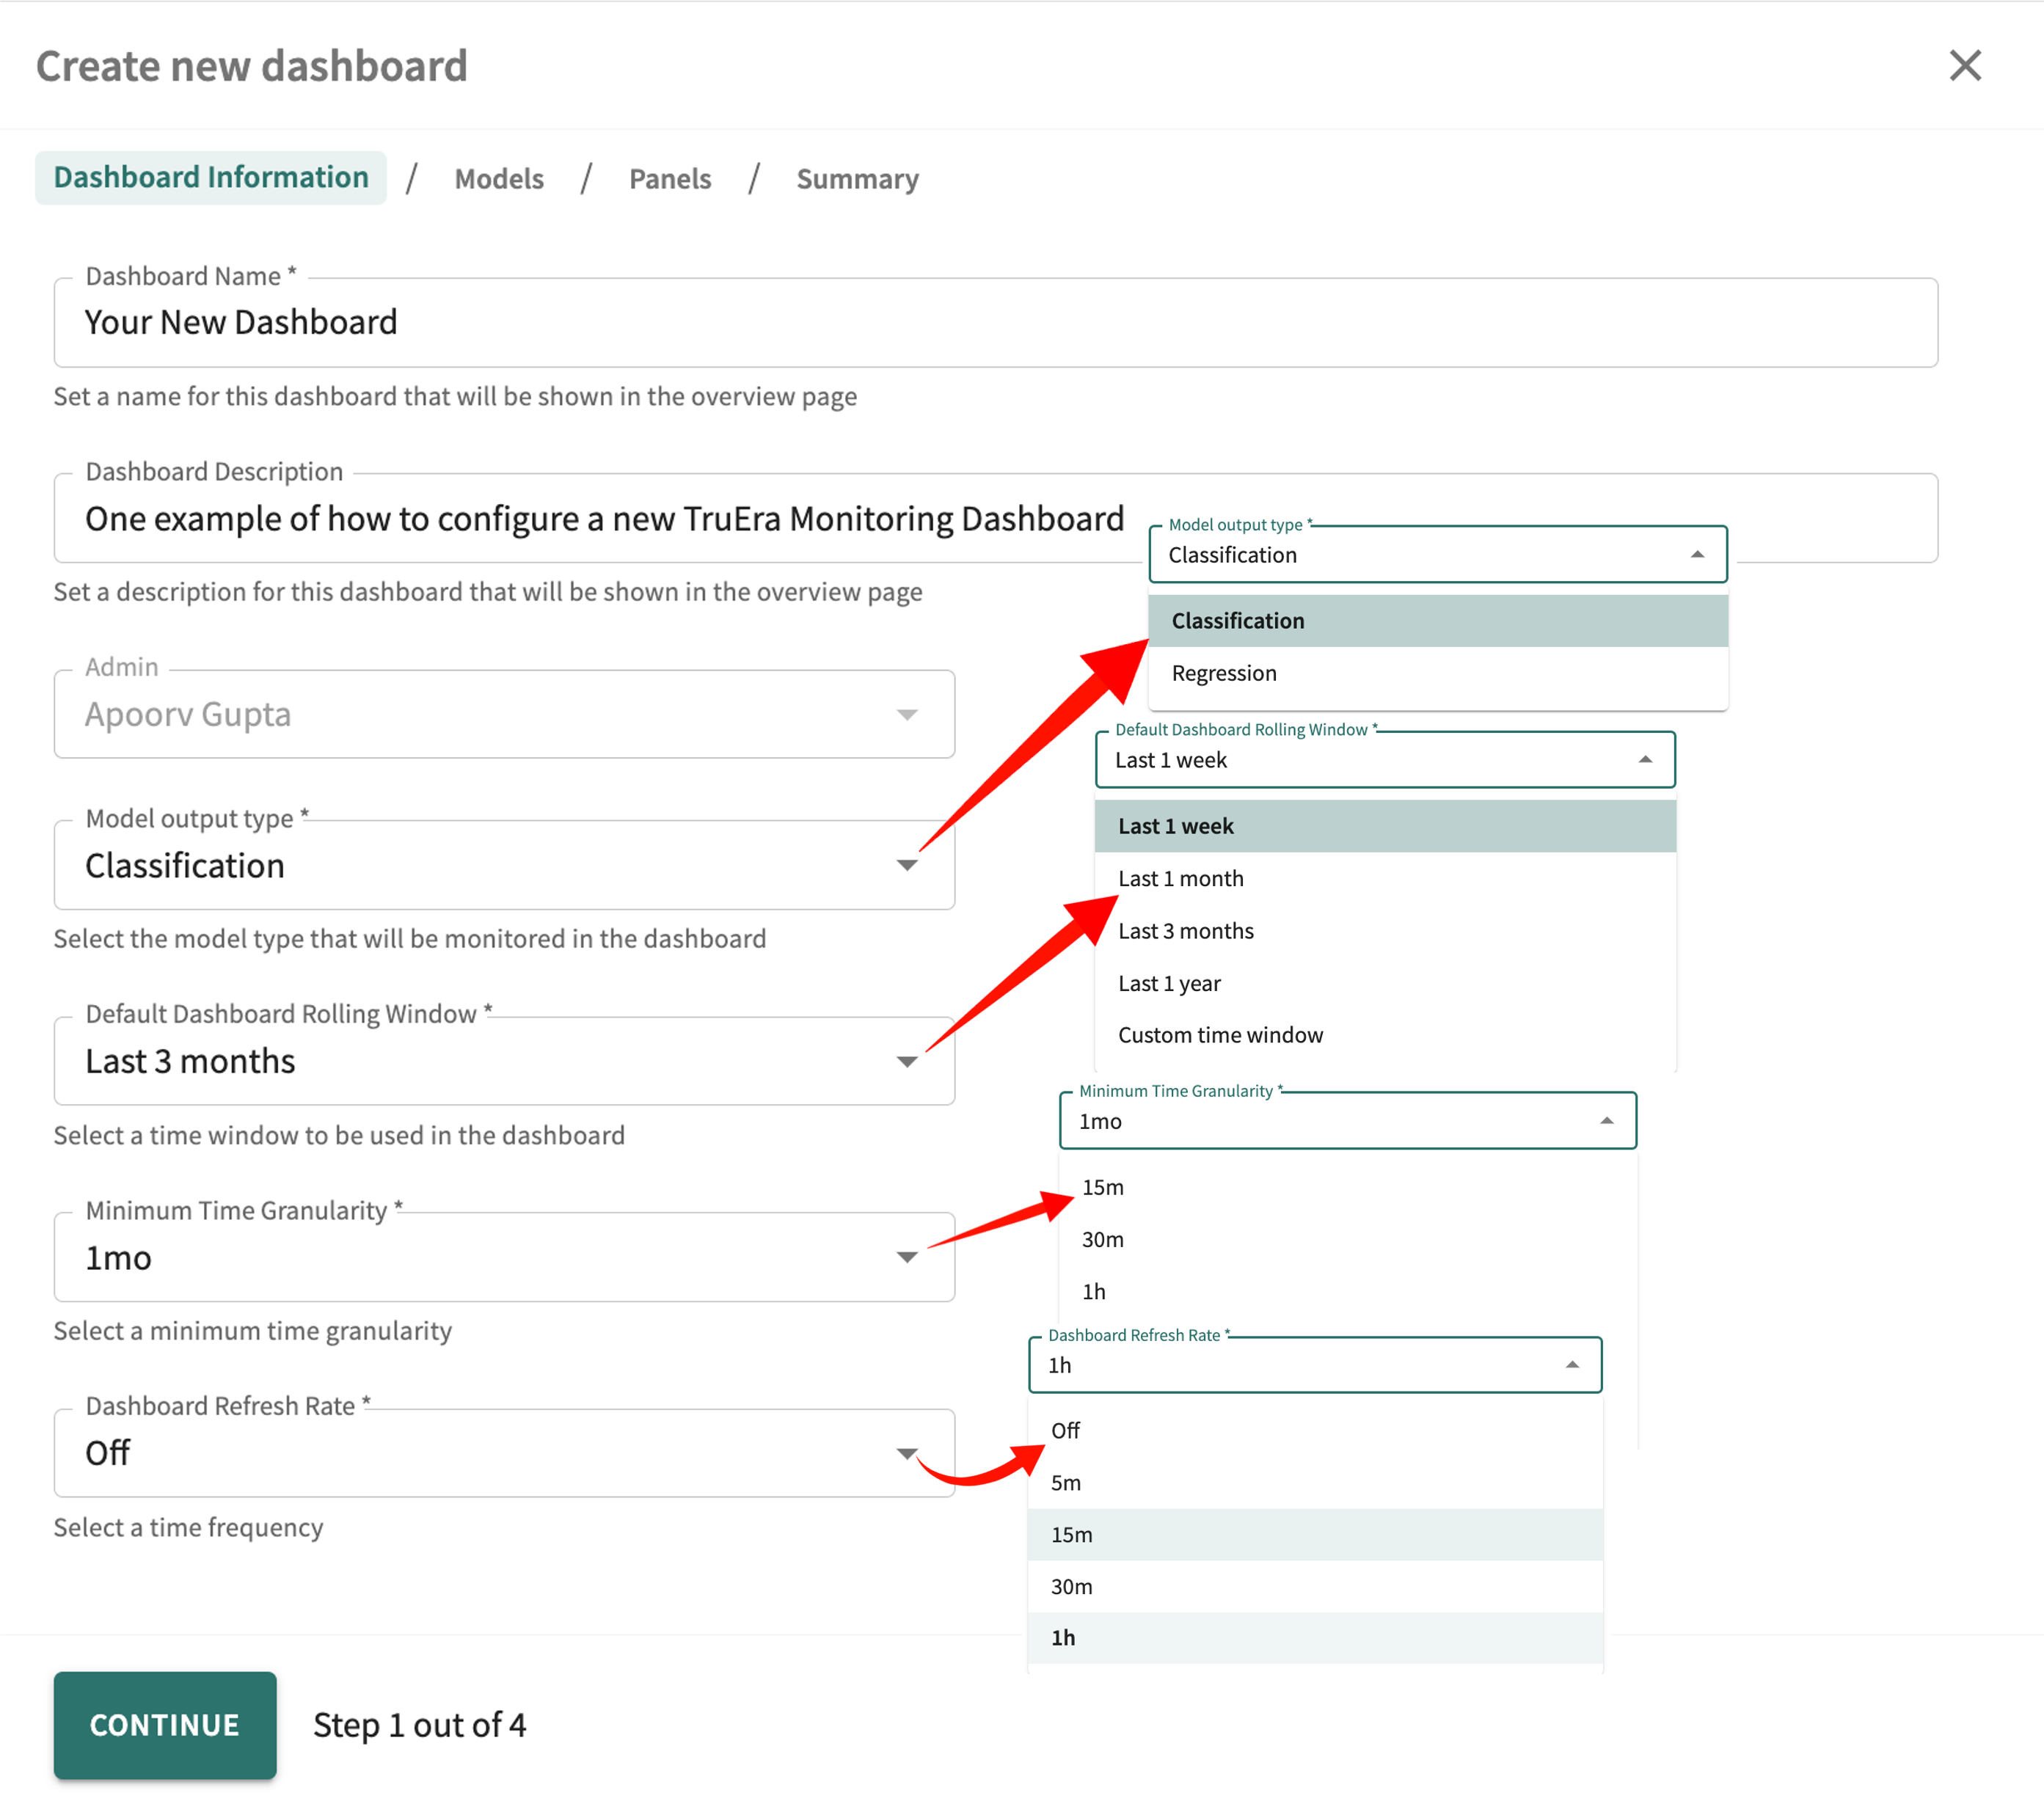
- Enter the Dashboard Name (required) — something intuitive or easily remembered is recommended, although whether you implement a complex or simple dashboard naming scheme — cryptic or straightforward — the optional Description should at least hint at its purpose to avoid confusion among the MLOps project collaborators and stakeholders that will eventually use it.
- Enter a dashboard Description (optional).
- Select a Model output type, either Classification or Regression.
- Select a Dashboard Refresh Rate. Off = never refresh; otherwise, choose a supported interval between 5 minutes (5m) and 1 hour (1h).
- Select a minimum Time Granularity for aggregating the values to display. Supported increments range from 15 minutes (15m) to 1 month (1mo).
- Select a Default Dashboard Rolling Window, which creates "summary historical" visualizations of your data at fixed intervals in the past — a week (Last 1 week), a month (Last 1 month), 3 months previously (Last 3 months), the year prior (Last 1 year), or you can specify a Custom time window with its own start and end dates — for comparison with more recent model outputs.
- Click CONTINUE to move on to the next step.
As you'll discover, the Admin (userid) field is automatically populated and cannot be changed. Once you save the new dashboard, changes to the Model output type are also disallowed. Otherwise, after completing the remaining configuration steps below, you can edit this or a different dashboard at any time. See Navigating Your Dashboards).
Step 2. Select Project Models
If you're using TruEra Monitoring as a standalone — i.e., not as part of a TruEra Diagnostics and Monitoring bundle — you must first ingest the models you want to include in the new dashboard. On the other hand, if you're using TruEra Diagnostics bundled with TruEra Monitoring, you can select from models already in the system for diagnostic evaluation, as well as those ingested specifically for production monitoring.
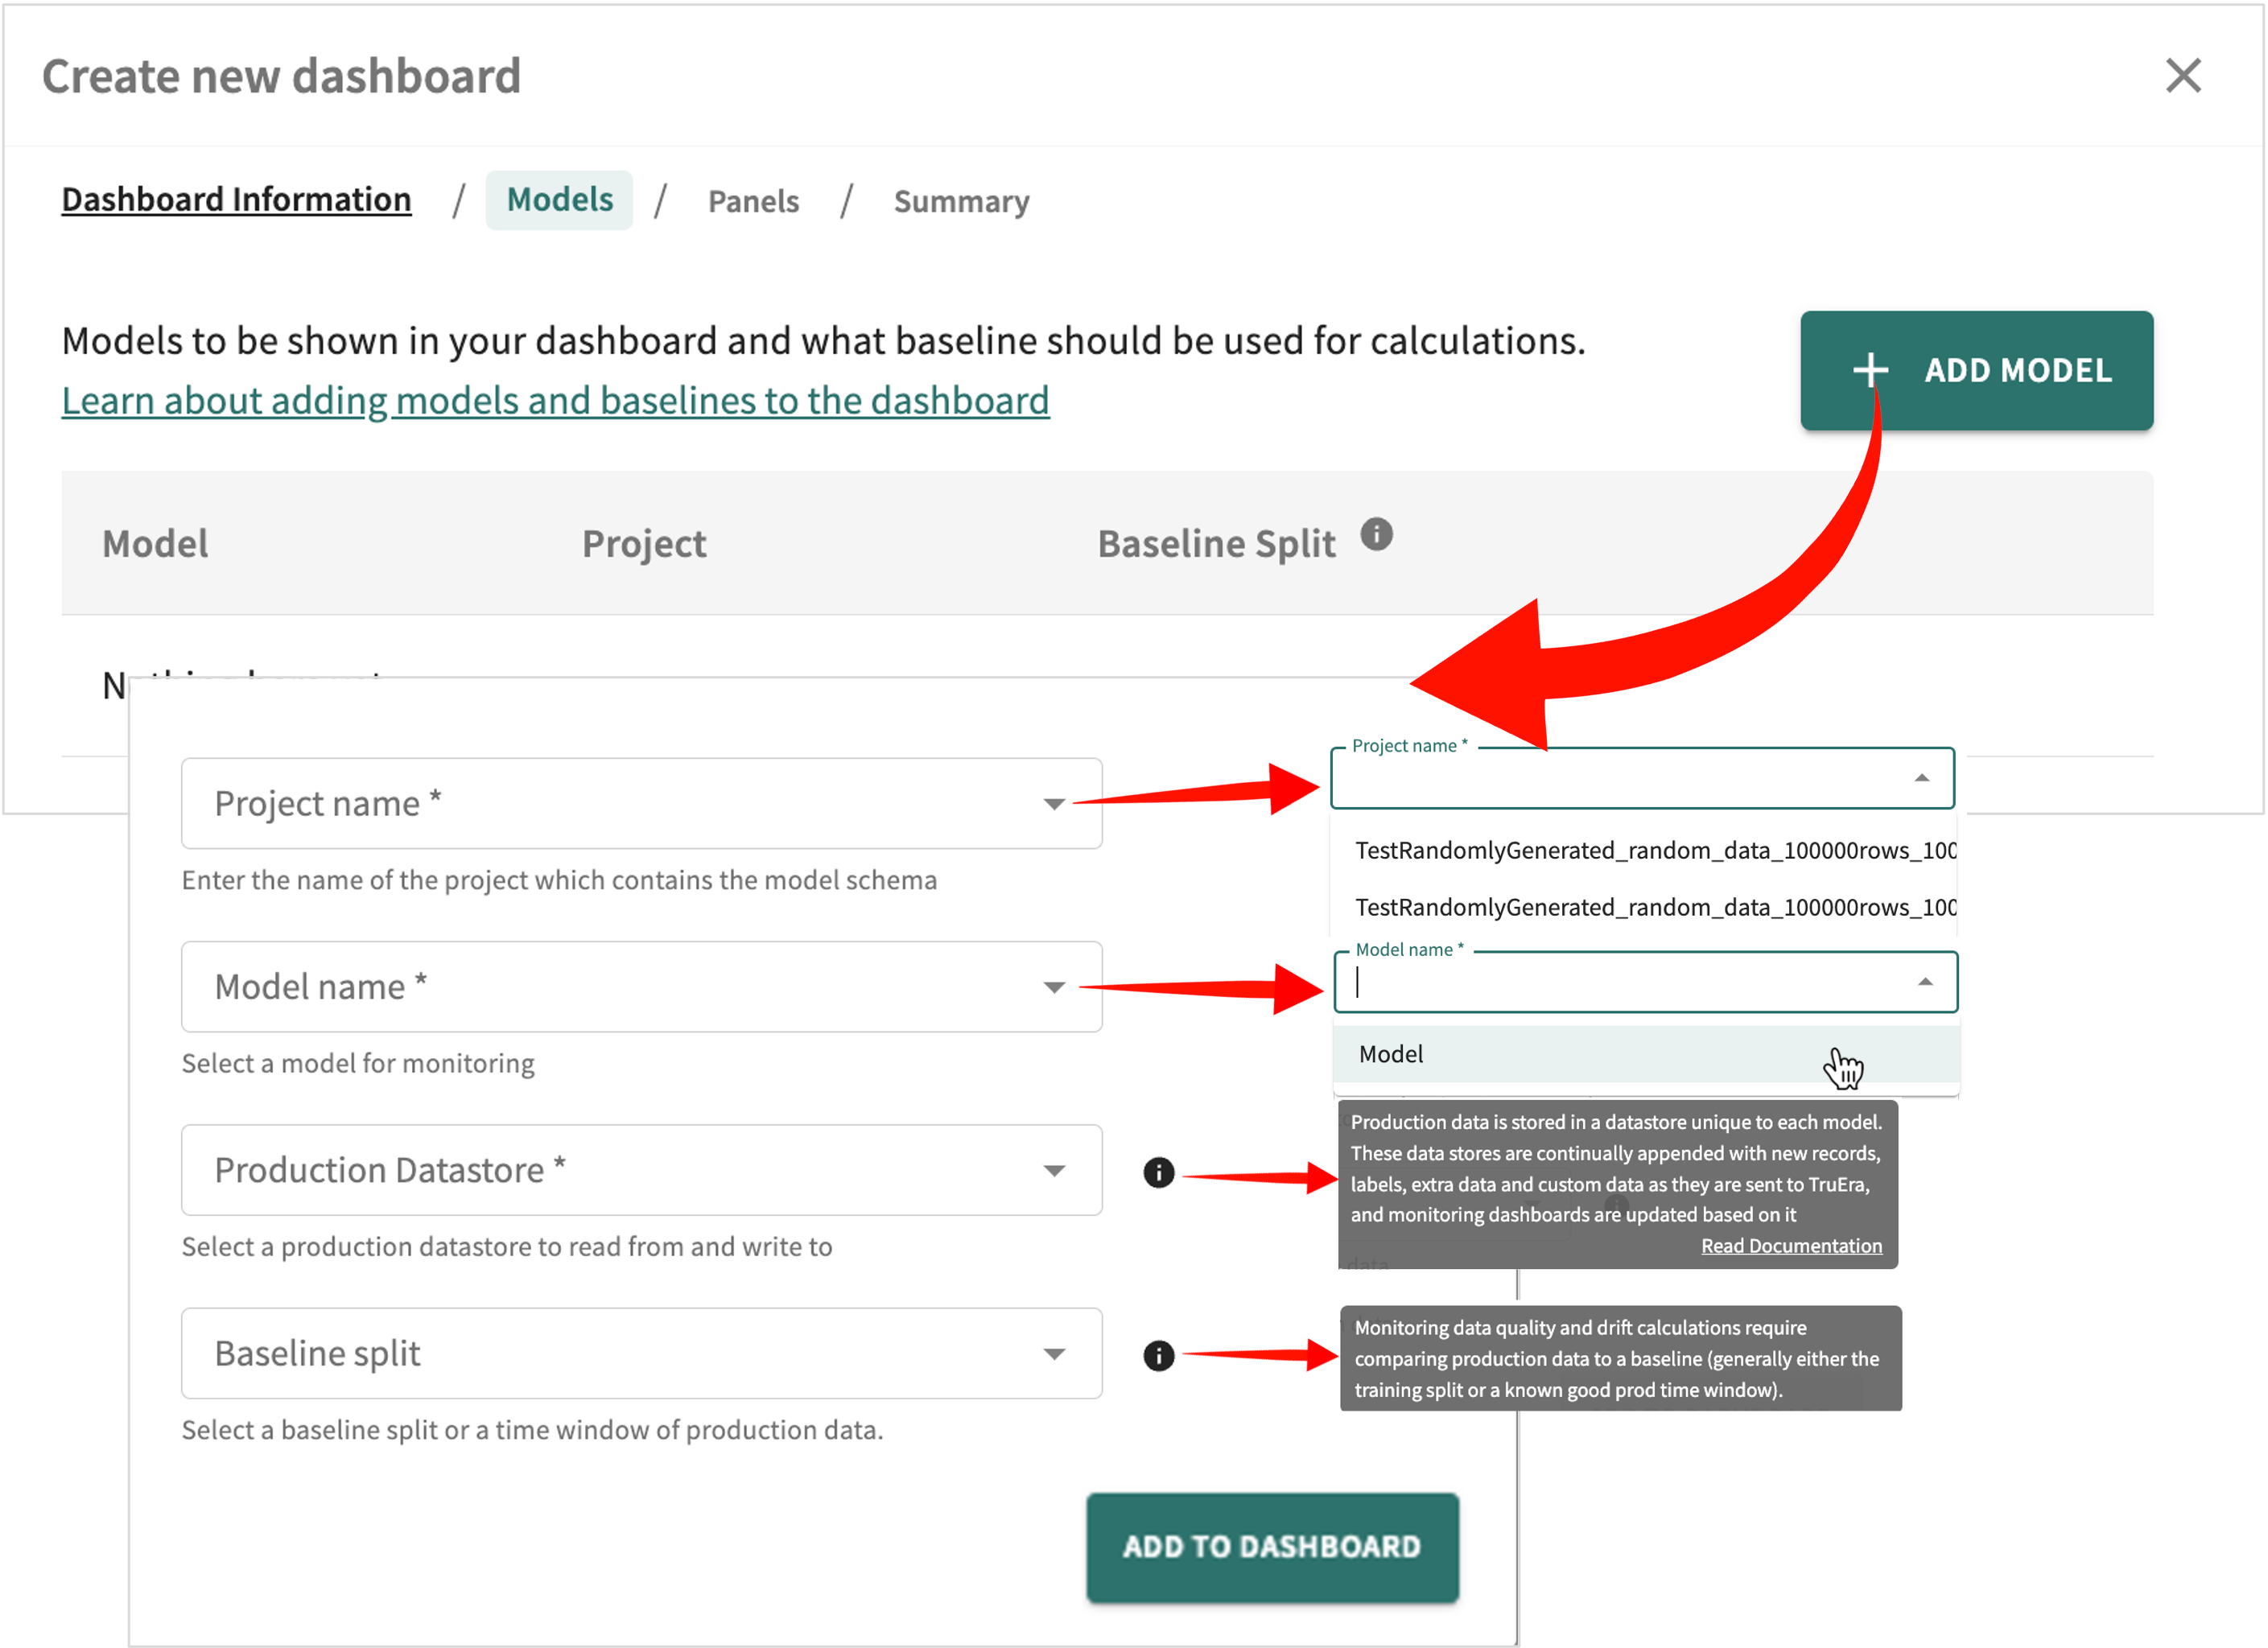
To add a model to the new dashboard, do the following:
- Select an existing TruEra Project name (required).
- Select a Model name (required) from the list of models currently belonging to the project you specified in (a).
- Select a Production Datastore (required).
For purposes of this quickstart, the datastore is the sample data collection you ingested earlier. Otherwise, it's production data ingested by batch or scheduled pull. - Select a baseline split — one of the train/test splits or a time range/window of the production data (prod) you specfied in (c) above.
- Click ADD TO DASHBOARD.
Next, add another model by clicking ADD MODEL or click CONTINUE to advance to Step 3.
Step 3. Select Dashboard Panels
You're now ready to choose the dashboard panels you want to see to visually monitor the performance and data quality of models you selected in the previous step.
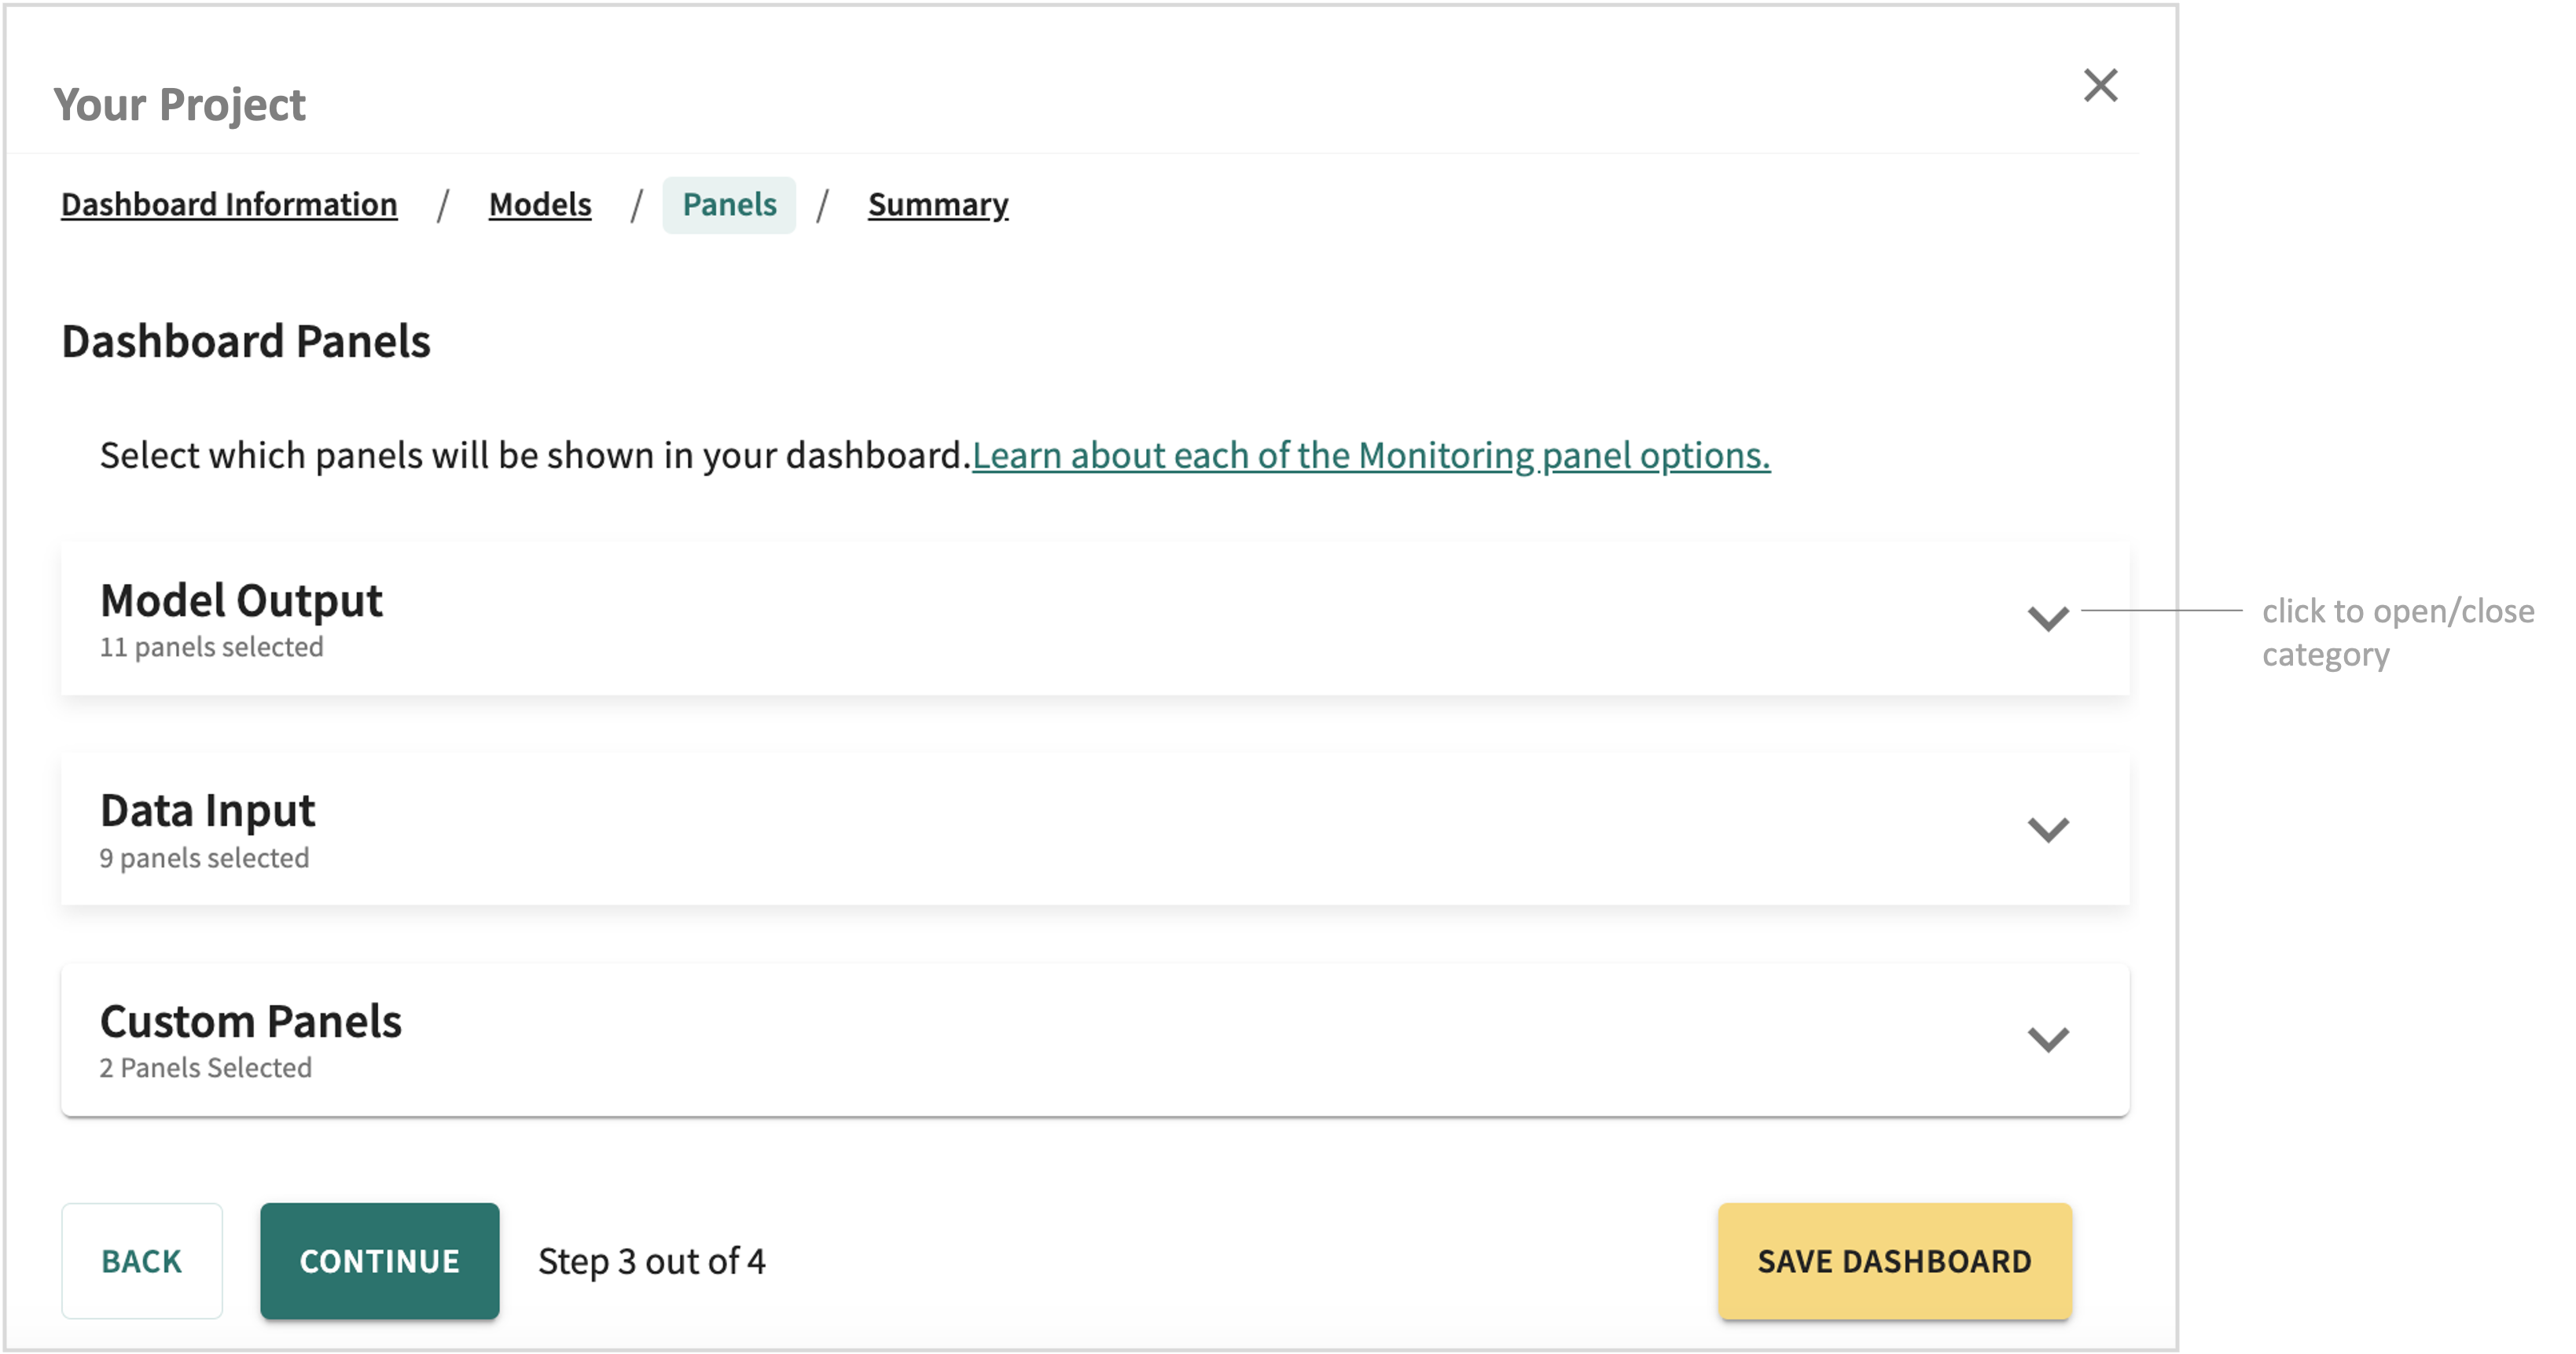
To select a panel for inclusion in your dashboard, click its respective checkbox.
Click here for the list of available panels by model type and metric.
An example of what each standard panel looks like is available in Exploring the Dashboard Panels. Because custom panels are unique to your particular use case, be sure to follow the onscreen instructions with regard to the distinction between segment tag performance and custom-level metrics.
After you make your selections, click CONTINUE to advance to the next step.
Step 4. Confirm the Dashboard Configuration
The final step in creating a dashboard is to review a summary of your new dashboard configuration.
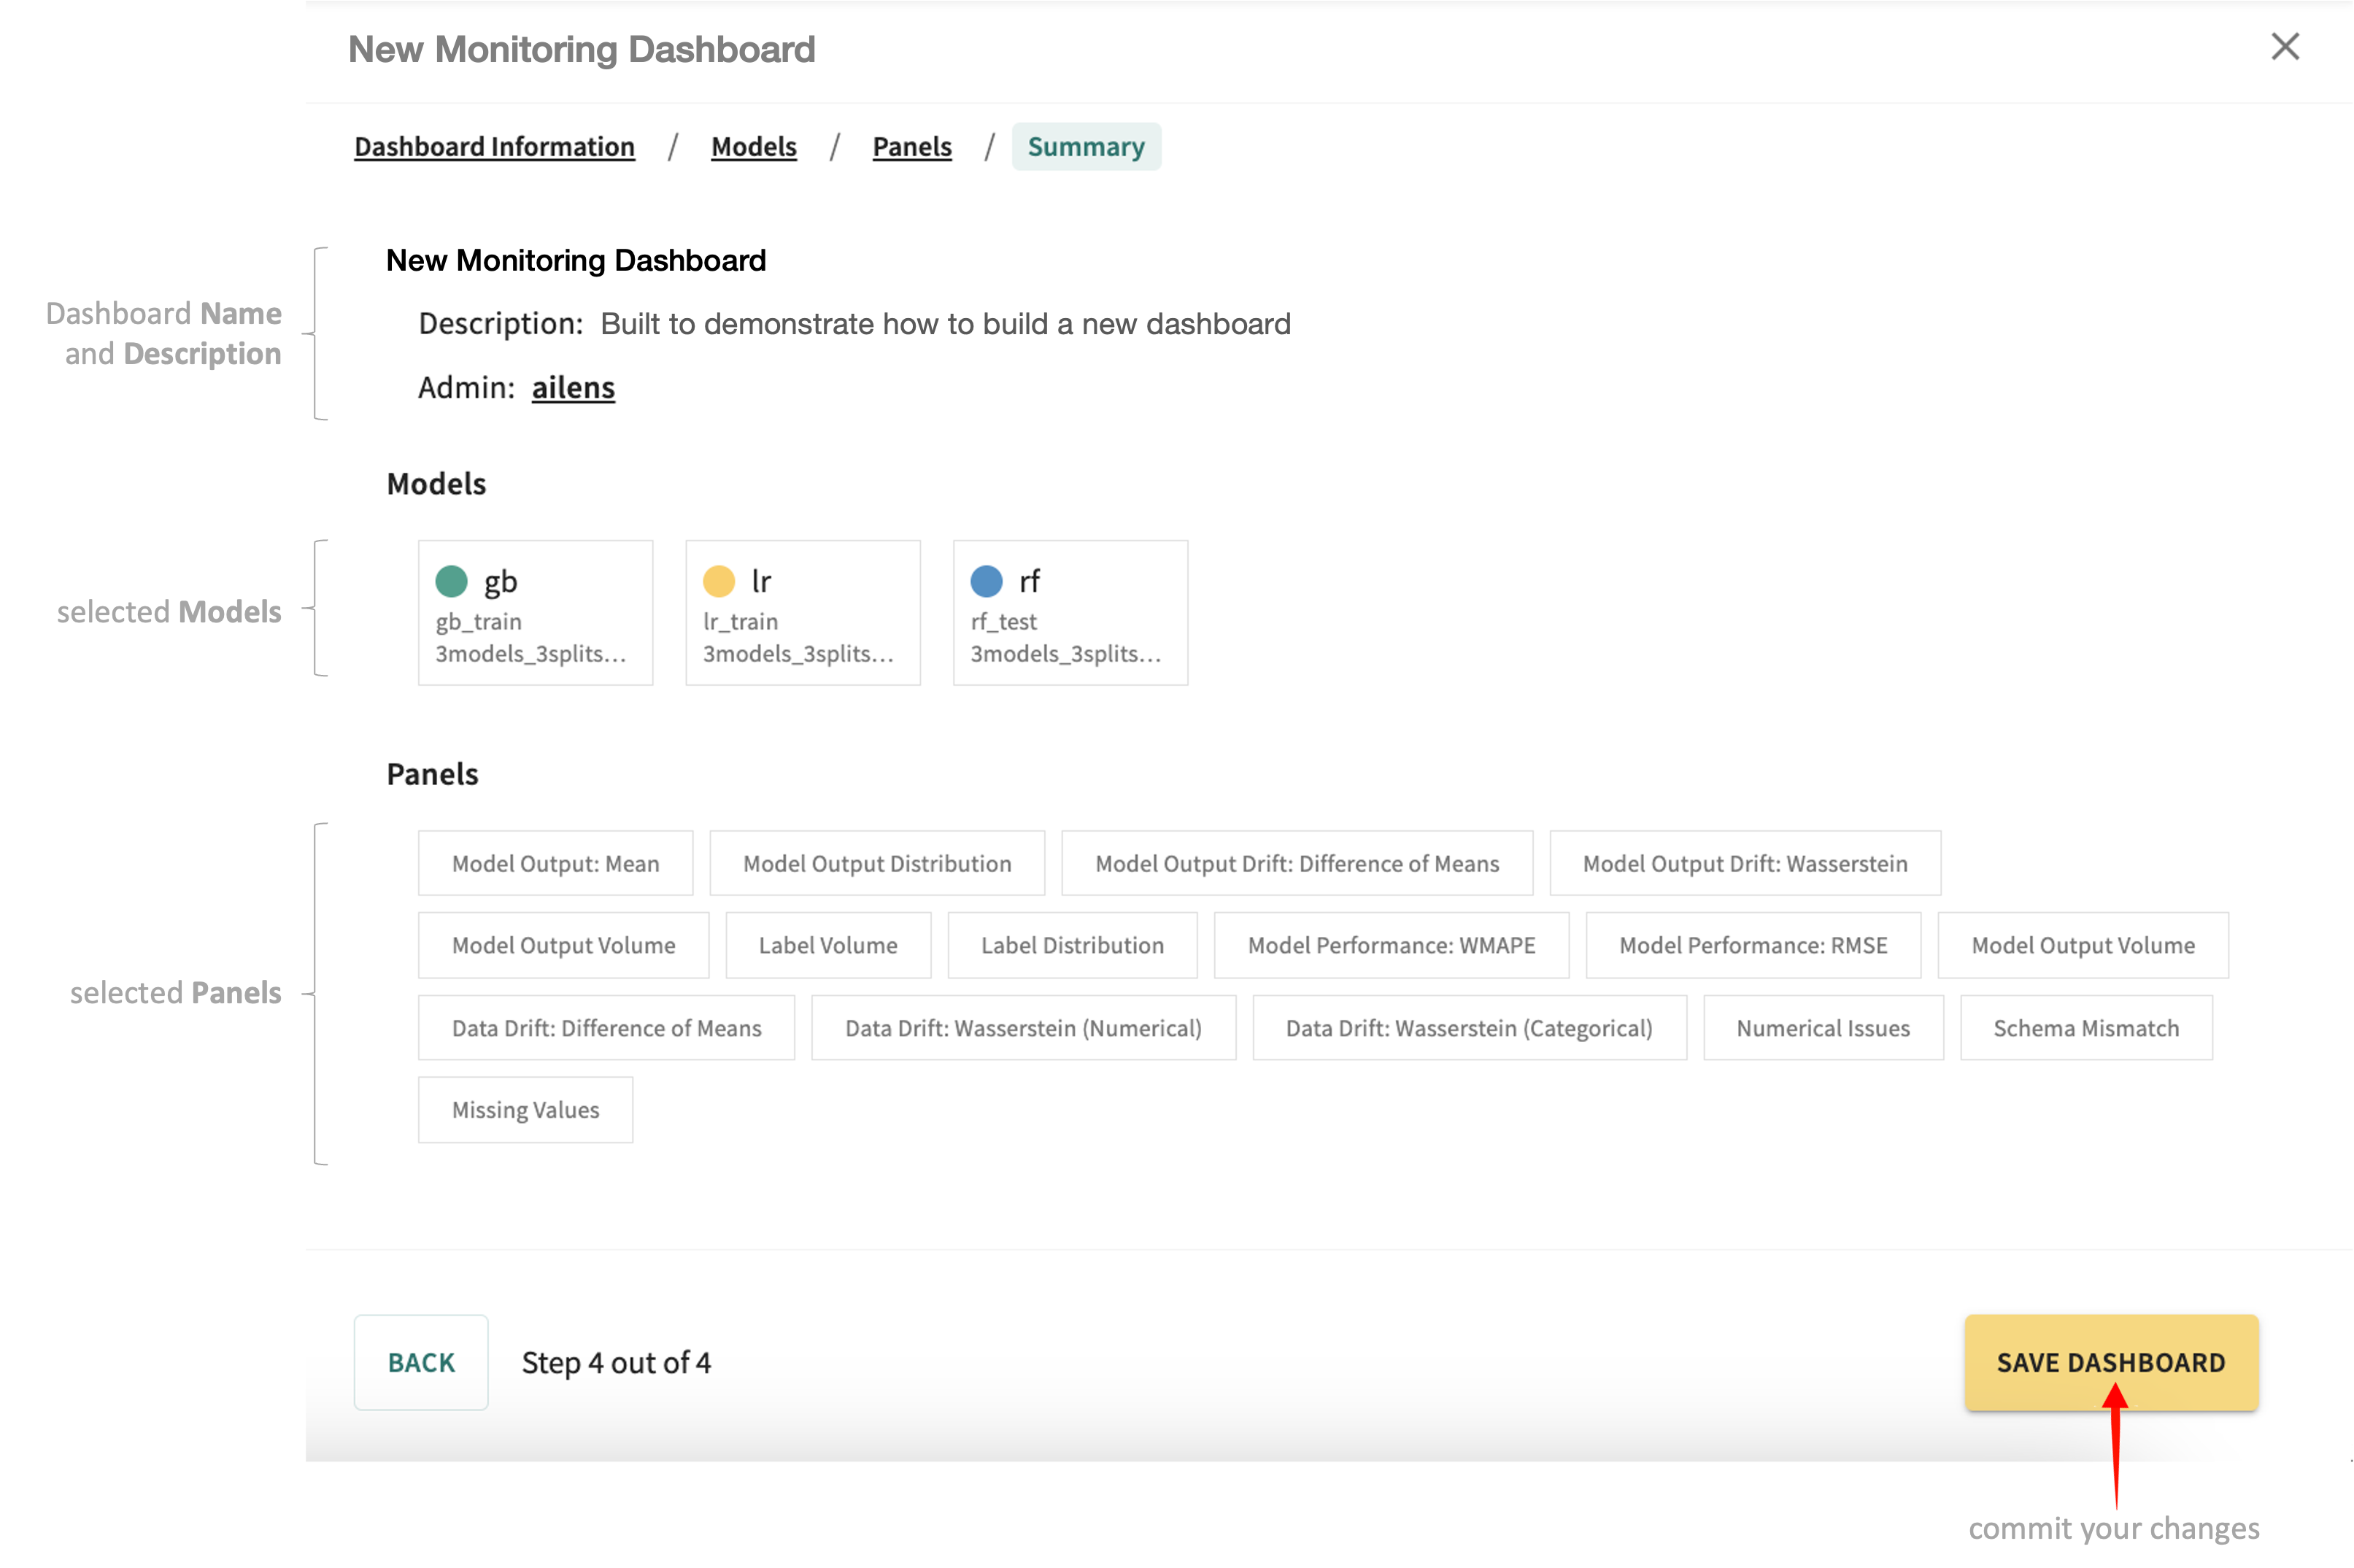
Click SAVE DASHBOARD to confirm the configuration summary. Click BACK to go to the previous step and make changes.
Once your dashboard is saved, you're ready to set up real-time monitoring alerts and notifications.
Click Next below to continue.