Machine Learning Operations
AI/ML engineering discipline focused on streamlining the process of taking machine learning models to production, and then maintaining and monitoring them.Dashboard Panels
TruEra Monitoring Dashboards are comprised of panels, each helping you to visualize and track a different aspect and/or metric for the production models included in the dashboard configuration.
Why?
Over the course of a production model deployment, a number of
MLOps
conditions can arise, signaling an unexpected change in certain model results and/or an impact on the usefulness of model predictions.This could include but isn't limited to:
- Shifts in the underlying data distribution, causing the model to "go stale."
- Edge cases in the production datastream not encountered during model development.
- Deployed model misconfiguration.
None of which stops the model from making "successful" predictions, at least from a service perspective, but the predictions are less likely to be useful.
TruEra Monitoring's dashboard panels help you detect and identify anomalous model behavior before there are costly business repurcussions, so you can take prompt action — actions that can range from triggering a model retraining or adjusting/updating the production datasource, all the way to taking the model offline for further investigation.
By now, you should have installed the TruEra client, ingested your model and production datastore, and created a dashboard to help track model output.
Next, let's take a deeper look at each available dashboard panel and the monitoring information it reports.
To display the panels for a selected dashboard:
- With the Monitoring tab open, select a Dashboard by clicking on its row.
- The default for Dashboard Views is Model. Scroll down to see each of your pre-configured panels (see Creating/Changing a Dashboard for guidance).
- Switch between Model and Data views by clicking the respective control in the left-hand navigator.
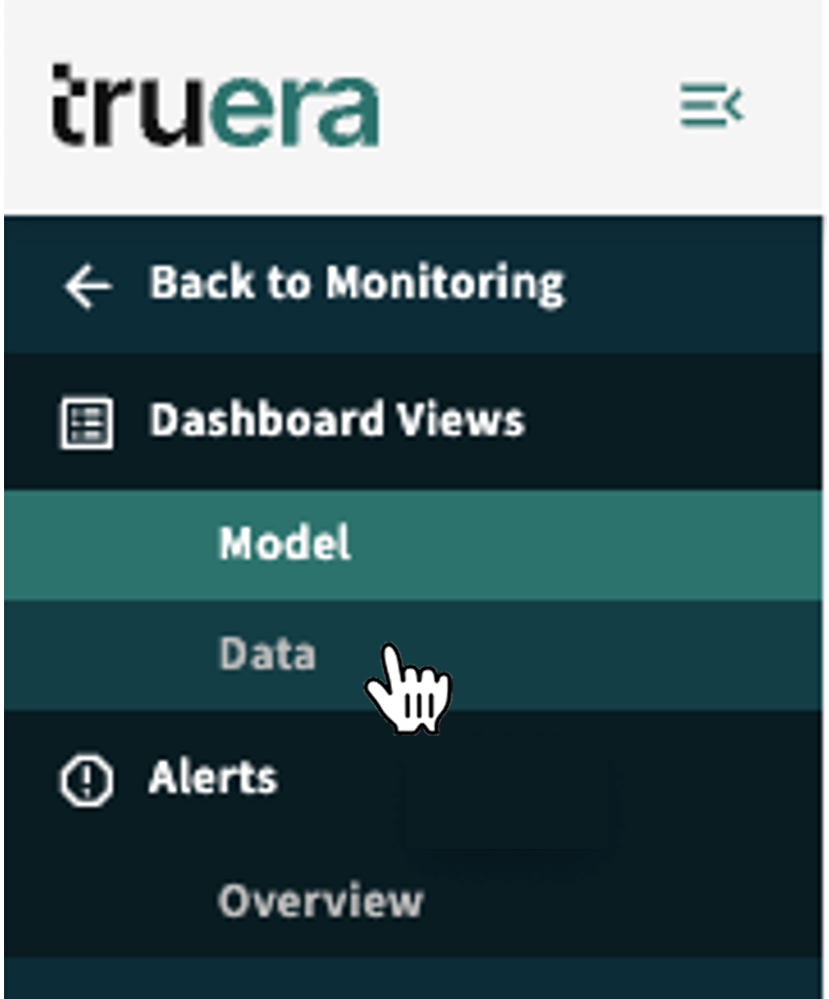
Return to your dashboard master list at any time by clicking ← Back to Monitoring.
Panel exploration in the next topic follows the structure in the table below. Click a panel link to quickly visit its description.
| Panel Type | Regression Model Panels | Classification Model Panels | ||||
|---|---|---|---|---|---|---|
| Model Output | Mean Volume Predictions and Labels Distribution Model Drift: Difference of Means Model Drift: Wasserstein | Mean Volume Model Drift: Difference of Means Model Drift: Wasserstein Distribution Decisions and Labels by Class Class Distribution Model Score Distribution | ||||
| Labels | Label Volume Label Distribution Label Drift | Label Volume Label Class Distributions | ||||
| Model Performance (requires labels) | RMSE WMAPE | AUC | ||||
| Data Input | Input Volume Data Drift: Difference of Means Data Drift: Wasserstein Out of Range Values | |||||
| Data Quality (tabular data only) | Unrecognized Categorical Numerical Issues Schema Mismatch Missing Values DQ Exploration | |||||
| Custom | Segment Performance Custom Level Metrics – General – Model – Record | |||||
Click Next below to continue.