Segments
Dividing and organizing your data into defined groups having one or more characteristics in common is called segmentation. Segments allow you to focus-in on a particular subdivision or slice of your population to more closely examine its impact on model accuracy, prediction scores, and explanations.
Before TruEra can help you analyze the segments in your model, you'll first need to define individual segments for a segment group you can create corresponding to one or more features. You can then specify a value or value range (min–max) for each segment you include in the segment group. Once a segment group is created, you can rename it, change its member segments, and redefine segment values or ranges.
If you've already created segments for the selected model, you'll most likely want to dive right into segment analysis. Click the starting point below that best fits your model's current status:
- I need to create and define segments for my model
- I want to analyze already defined segments in my model
- I want to change/redefine existing segments in my model
Creating and Managing Segments
As introduced above, segmenting your data is the process of dividing it into groups that share similarities. When you segment for supervised learning, you know what to target.
For instance, if you're looking for a group or groups of people that are likely to buy luxury-class automobiles, you'll probably want to target (a) those in a high-income bracket, (b) those with high net worth, (c) those with an excellent credit rating, and/or (d) those who have purchased a luxury car within the recent past. At the same time, you'll want to exclude individuals whose financial circumstances do not easily fit into any of these categories.
Even so, financial condition alone may constitute too large a group for the most accurate targeting. Adding age as a dimension might aid in differentiating the younger set who largely prefer more sporty models from individuals who've reached an age where they typically prefer richly appointed quality and comfort to speed. Then there's location. People living in the most affluent suburbs may be more likely to buy a high-end luxury ride, whereas those in rural areas may tend toward something more rugged, like a 4WD SUV or truck better designed for rough roads.
Let's assume all of these dimensions, or features, are included in your dataset. TruEra can help you to create segments accordingly.
Click MANAGE SEGMENT GROUPS to get started.
Creating/Adding a Segment Group
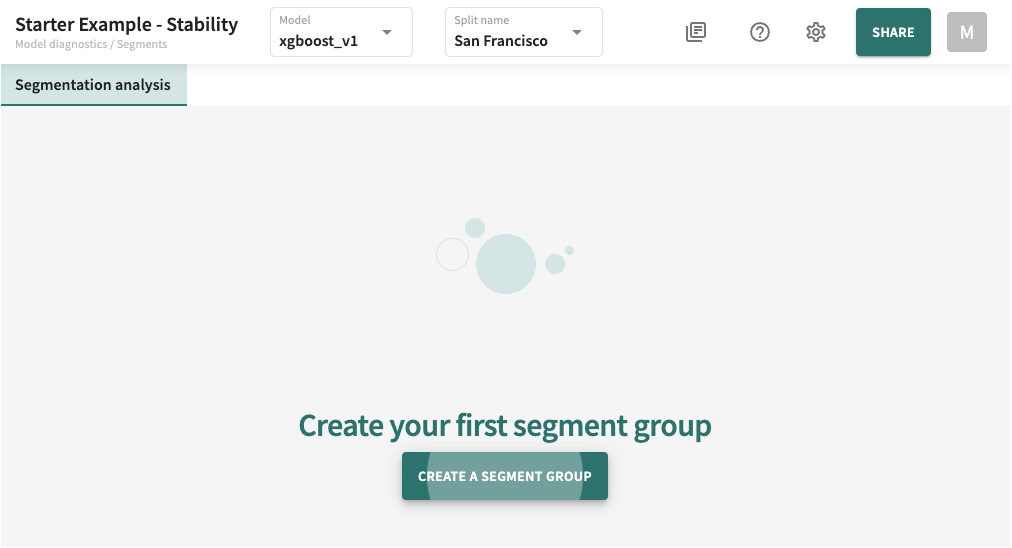
If you haven't yet created any segment groups for this model and split, click CREATE A SEGMENT GROUP when prompted.
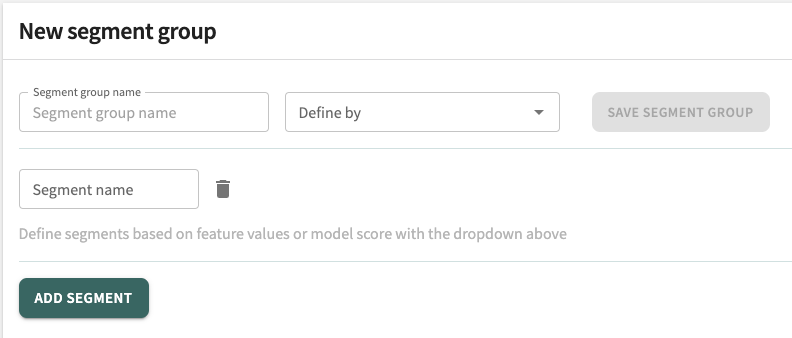
To define and add a new segment group:
- Enter a Segment group name. What you choose to call it is entirely up to you, but it should be descriptive enough to easily tell what it contains.
- Click the Define by dropdown to select one or more features that will characterize this segment group.
- Enter a Segment name and select one or more Segment values or a range (min/max) allowable for the segment.
- Click ADD SEGMENT to define another segment by feature for this segment group, then repeat Step 3.
- When you've completed the feature definition, click SAVE SEGMENT GROUP to add the group for segment analysis. You can come back and edit segment groups at any time.
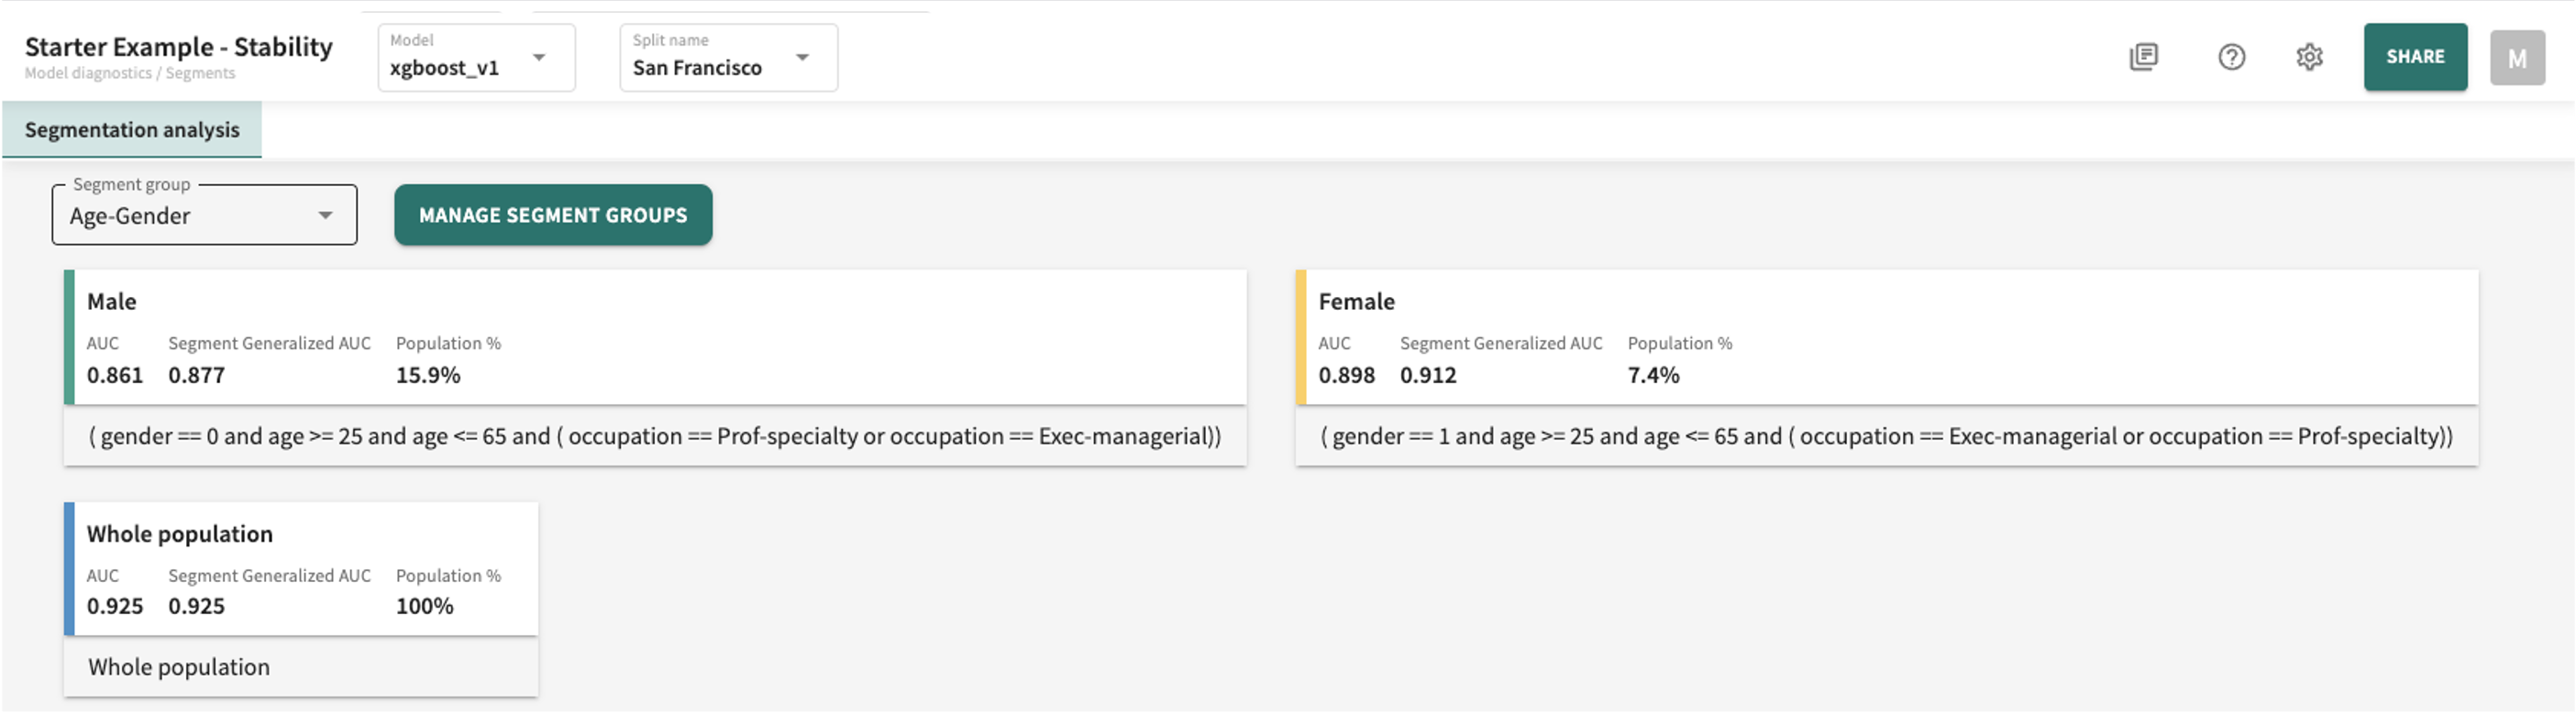
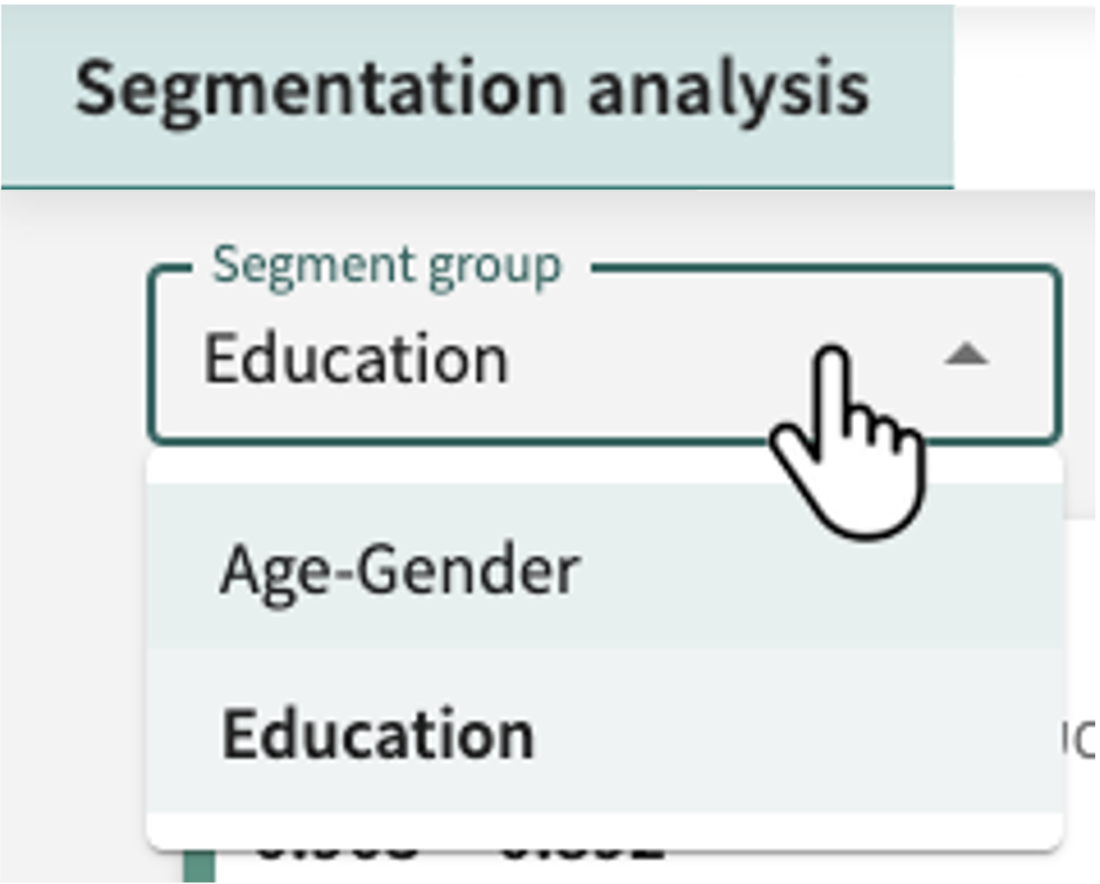
This takes you to the Segmentation analysis tab, where your new Segment group definition is now displayed.
Editing/Deleting a Segment Group
If you need to change the composition or values of an existing segment group:
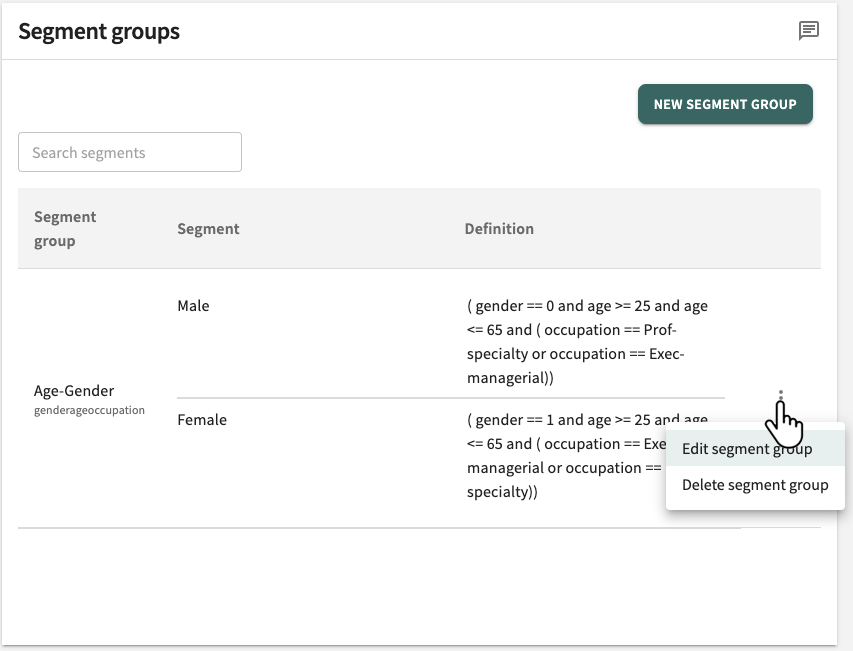
- Under the Segment analysis tab, click MANAGE SEGMENT GROUPS.
- Click to the right of the Segment group you want to edit and select Edit segment group.
- Make your changes. You can add or remove features, change segment values/ranges, and even add a new segment to the group.
Click SAVE SEGMENT GROUP when your changes are complete.
Delete a Segment group by clicking , selecting Delete segment group (pictured above) and confirming when prompted.
Analyzing Segments
As already discussed, data segmentation comprises techniques for dividing your data into groups sharing common characteristics. Segment analysis helps you assess what those characteristics might mean with respect to your modelling objective when segments are scored. The results reflect the outcomes returned in terms of probability scores for classification problems and estimated averages for regression problems.
Tip
You can add new segments to a segment group and create new segment groups whenever desired. See Creating and Managing Segments for guidance.
For the segment group selected, TruEra's segment analysis presents a visualization of the scored values for your defined segments organized into four panels:
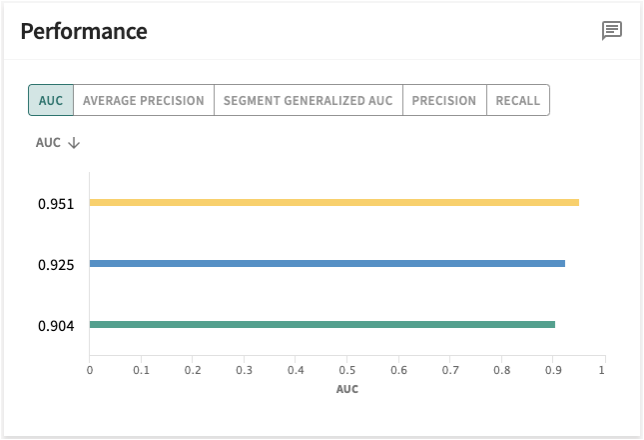
Segment Performance
Measures the performance of color-coded segments defined for the selected model and split where the input is a probability value between 0 and 1.
Perhaps more clearly understood when differentiated from accuracy, segment performance results compare the prediction to the ground truth, computed in terms of:
-
AUC – aka Area Under the Receiver Operating Characteristic (AUROC) — scale invariant; the probability that a randomly selected positive example has a higher predicted probability of being positive than a randomly selected negative example. AUROC is calculated as the concordant percent + 0.5 times the tied percent. It is the area underneath a curve that measures the tradeoff between true positive rate (TPR) and false positive rate (FPR) at different decision thresholds. When AUC = 1, then the classifier is able to perfectly distinguish between all the positive and the negative class points correctly. If, however, the AUC had been 0, then the classifier would be predicting all negatives as positives, and all positives as negatives.
Click the AUC tab to see how the results for each segment in the segment group compare to the whole population.
-
AVERAGE PRECISION – aka Area Under the Precision-Recall Curve; calculated as the area under a curve that measures the tradeoff between precision and recall at different decision thresholds, thereby indicating whether your model can correctly identify all the positive examples resulting without accidentally marking too many negative examples as positive.
Click the AVERAGE PRECISION tab to see how the results for each segment in the segment group compare to the whole population.
-
SEGMENT GENERALIZED AUC – Click the SEGMENT GENERALIZED AUC tab to see how the results for each segment in the segment group compare to the whole population.
-
PRECISION – measures the probability that a detected boundary is contained in the ground truth, then reports the percentage that is truly positive out of all the positive predicted. Its value should always be between 0 and 1.
Click the PRECISION tab to see how the results for each segment in the segment group compare to the whole population.
-
RECALL – measures the model's ability to correctly predict the positives out of actual positives. This is unlike precision which measures how many predictions made by models are actually positive out of all positive predictions made.
Click the RECALL tab to see how the results for each segment in the segment group compare to the whole population.
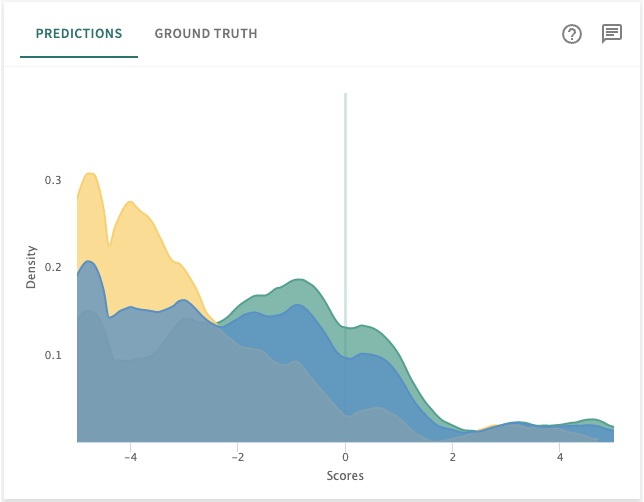
Predictions
TruEra's visualizations of segment prediction scores reflect probable outcomes returned by the model using only segment data.
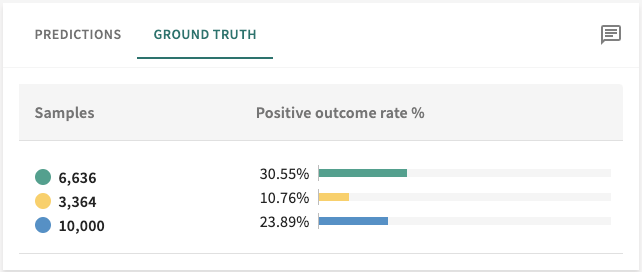
Ground Truth
Ground truth checks the results of the model's predictions against the real world.
Feature Analysis
Paralleling the results for an entire split in Features, the All features panel here scores the selected segment group in much the same way.
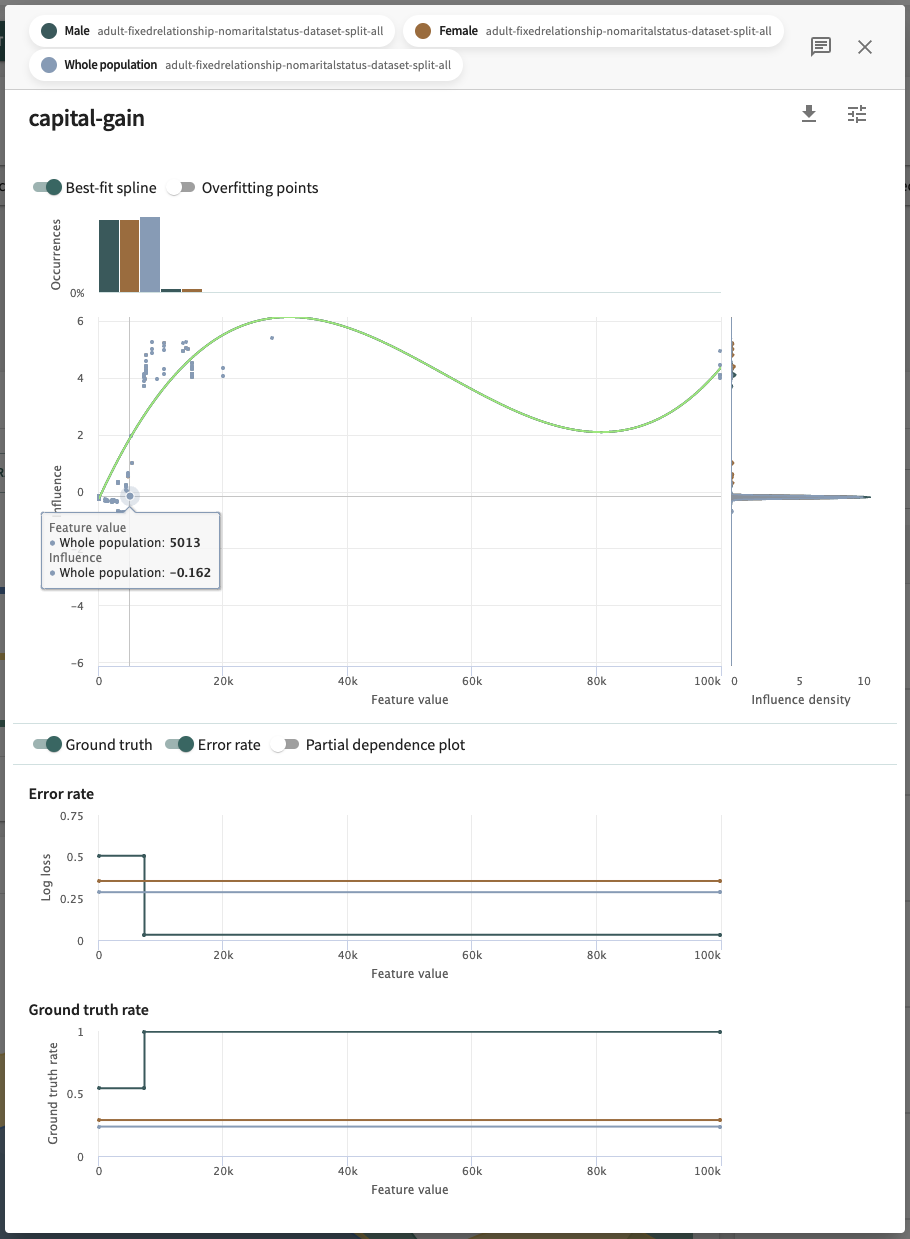
- Influence sensitivity plot (ISP) – also known as the feature's influence, it shows the relationship between the feature’s value and its contribution to the model's segment group output. Overlaid to contextualize the ISP by showing particularly sparse or dense regions is a **distribution of the feature values** (shown at the top) and the distribution of influences (shown on the right). For more on ISPs, including advanced features like the ISP best-fit splines and overfitting points diagnostics, see Influence Sensitivity Plots.
To view the details of a listed feature:
- Click a displayed feature in the All features panel.
- Click to download the results to a CSV file.
- Click to set a value domain or edit its separated values.
- Save your changes.
Click Next below to continue.
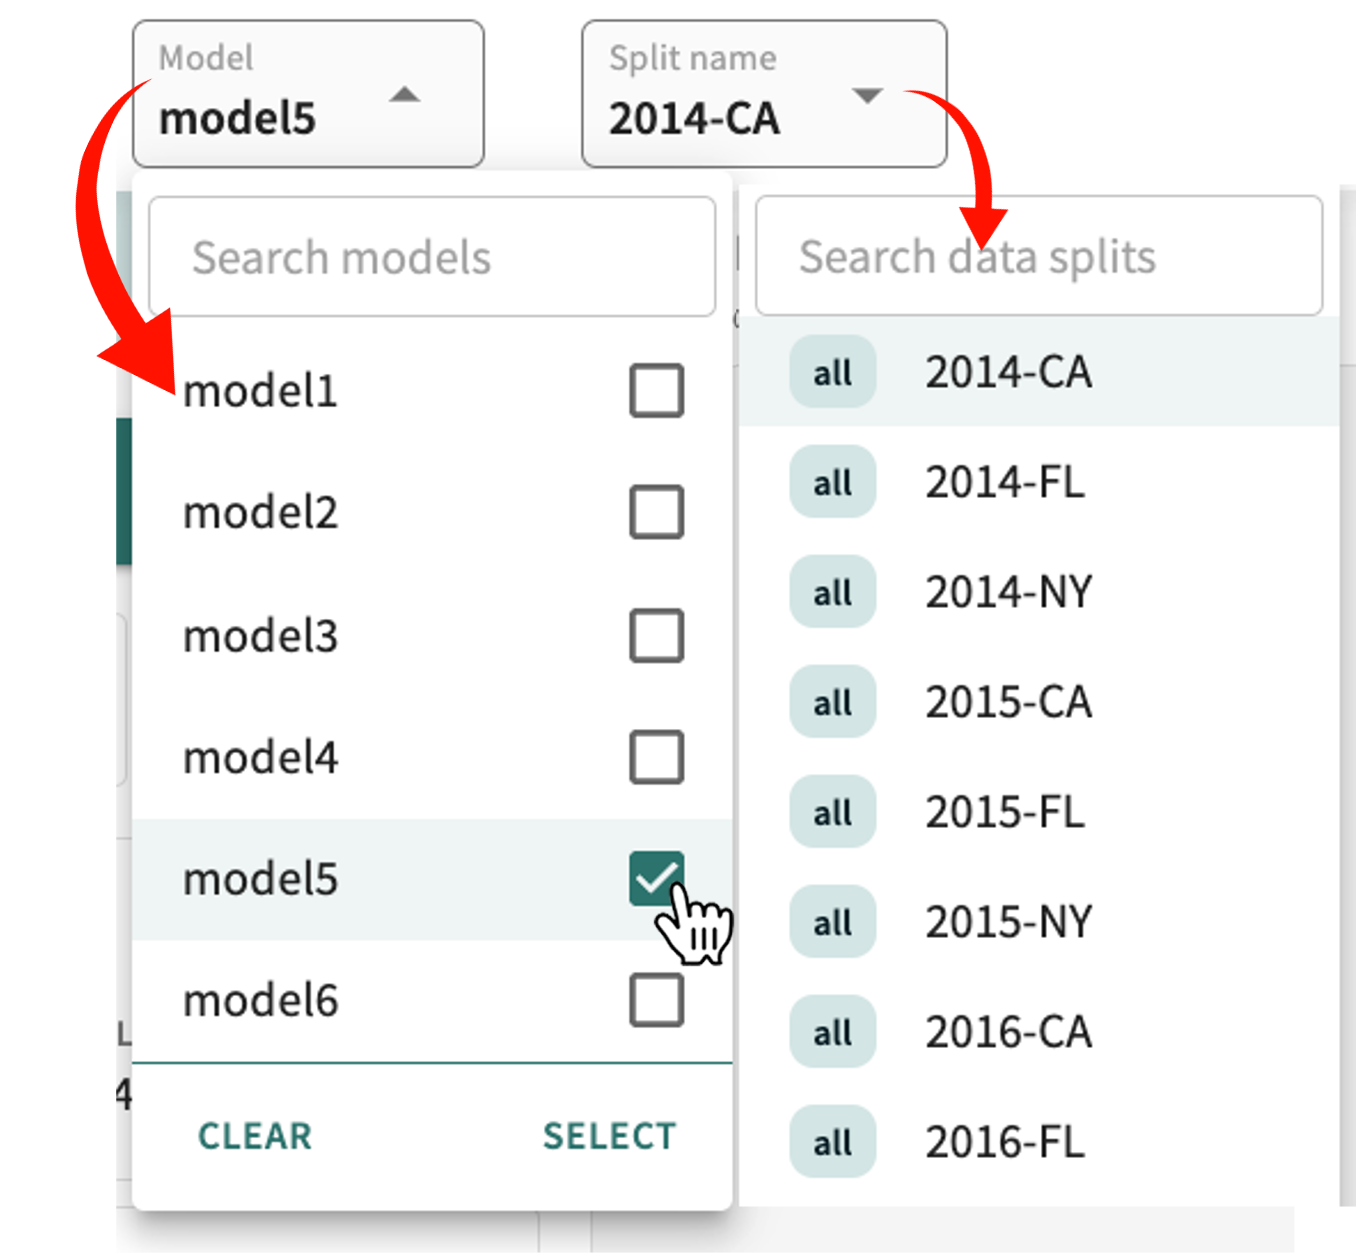
- Click the Model selector.
- Deselect the currently selected model(s), then select the desired model(s).
- Click SELECT.
- Click the Split name selector.
- Select the desired split.
Search for a model or split by entering a parial or full string in the respective search box.
Features that affect or impact the outcome of your model more than other features, either positively or negatively, are said to have influence. The most obvious way to identify an "influential" feature is to delete it from the model's training data. Should this produce signicant changes in model output, the deleted feature can safely be considered influential.
When a single datapoint is an outlier, it is called an "interesting" instance. An interesting instance can skew the influence of a feature.
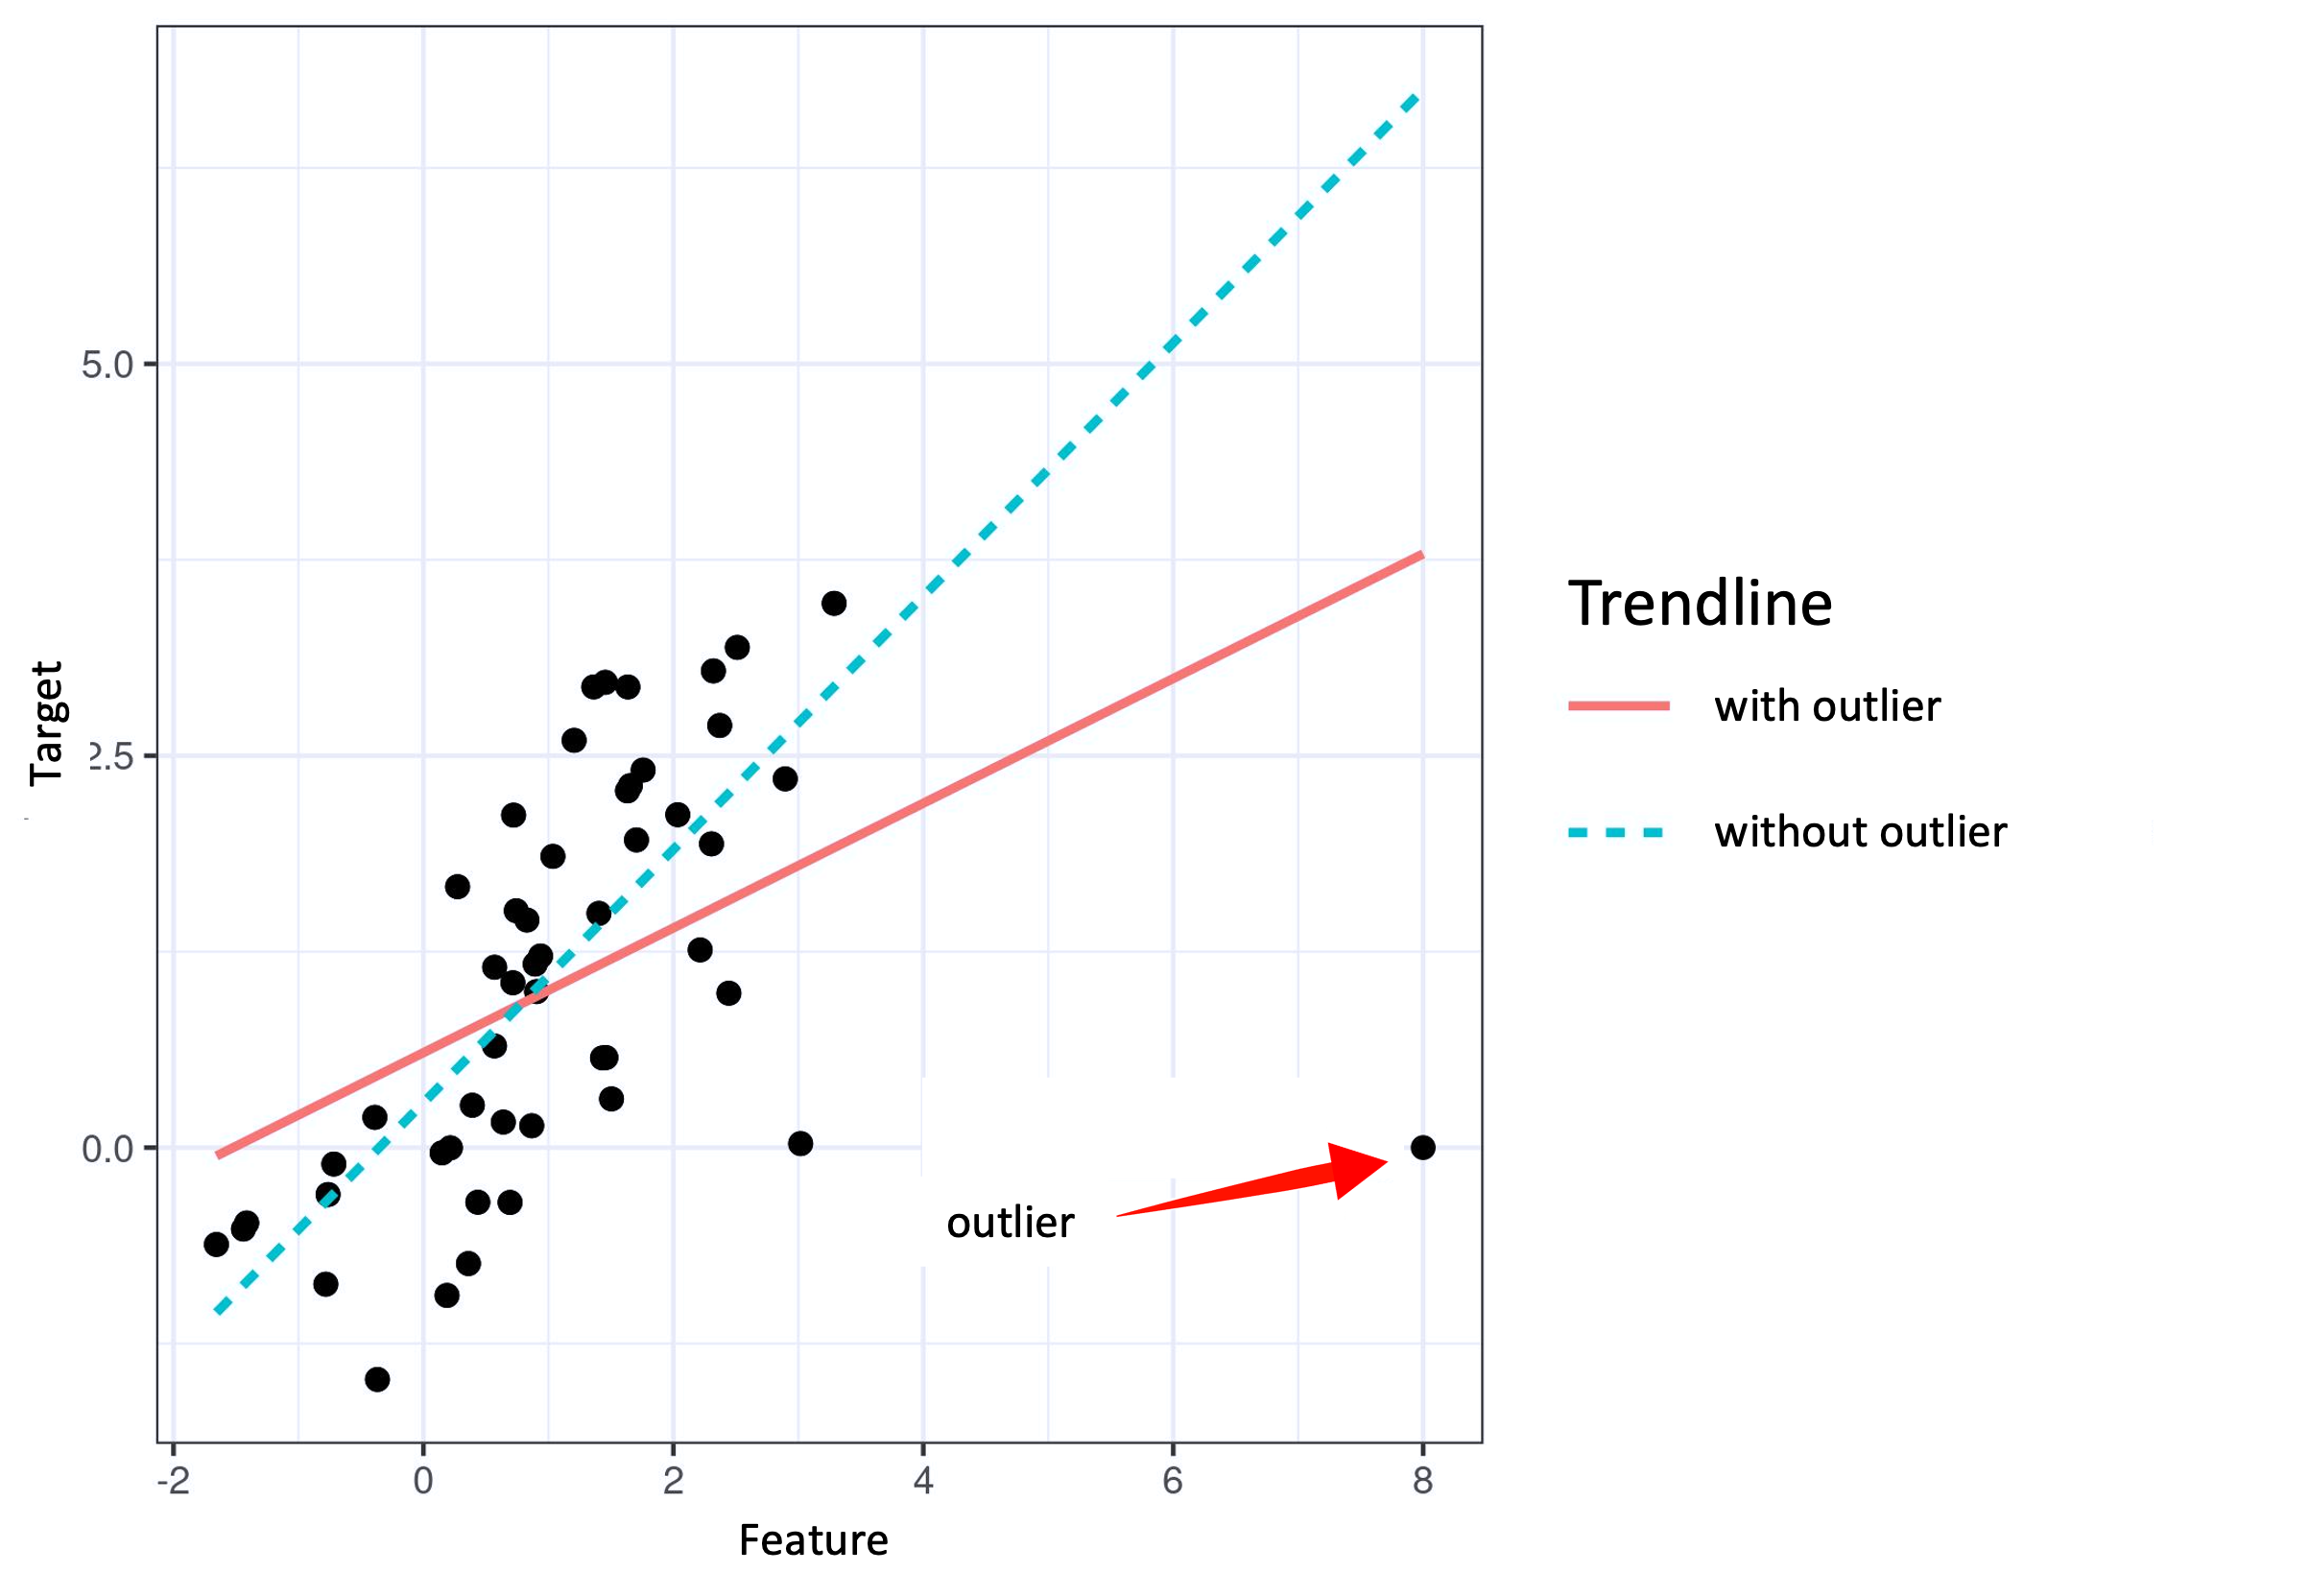
Hence, it follows that the more a model's parameters or predictions change when the model is retrained with the interesting instance removed, the more influential that instance is.