Artificial Intelligence Quotient
(aka explainable AI, or XAI) – set of tools used by AI/ML developers and operators to achieve sustainable levels of trust in the decisions (output) of machine learning systems.Model Leaderboard
A typical project invariably entails training and refining multiple models on the way to producing the most accurate and sustainable results. Keeping on top of it all, especially with respect to comparing model performance, can be a challenge. To assist you, the Web App's **Model Leaderboard** summarizes all of your models, including the metrics computed on train and test splits for each model, along with a summary of the model's
AIQ
Test results with accompanying metadata.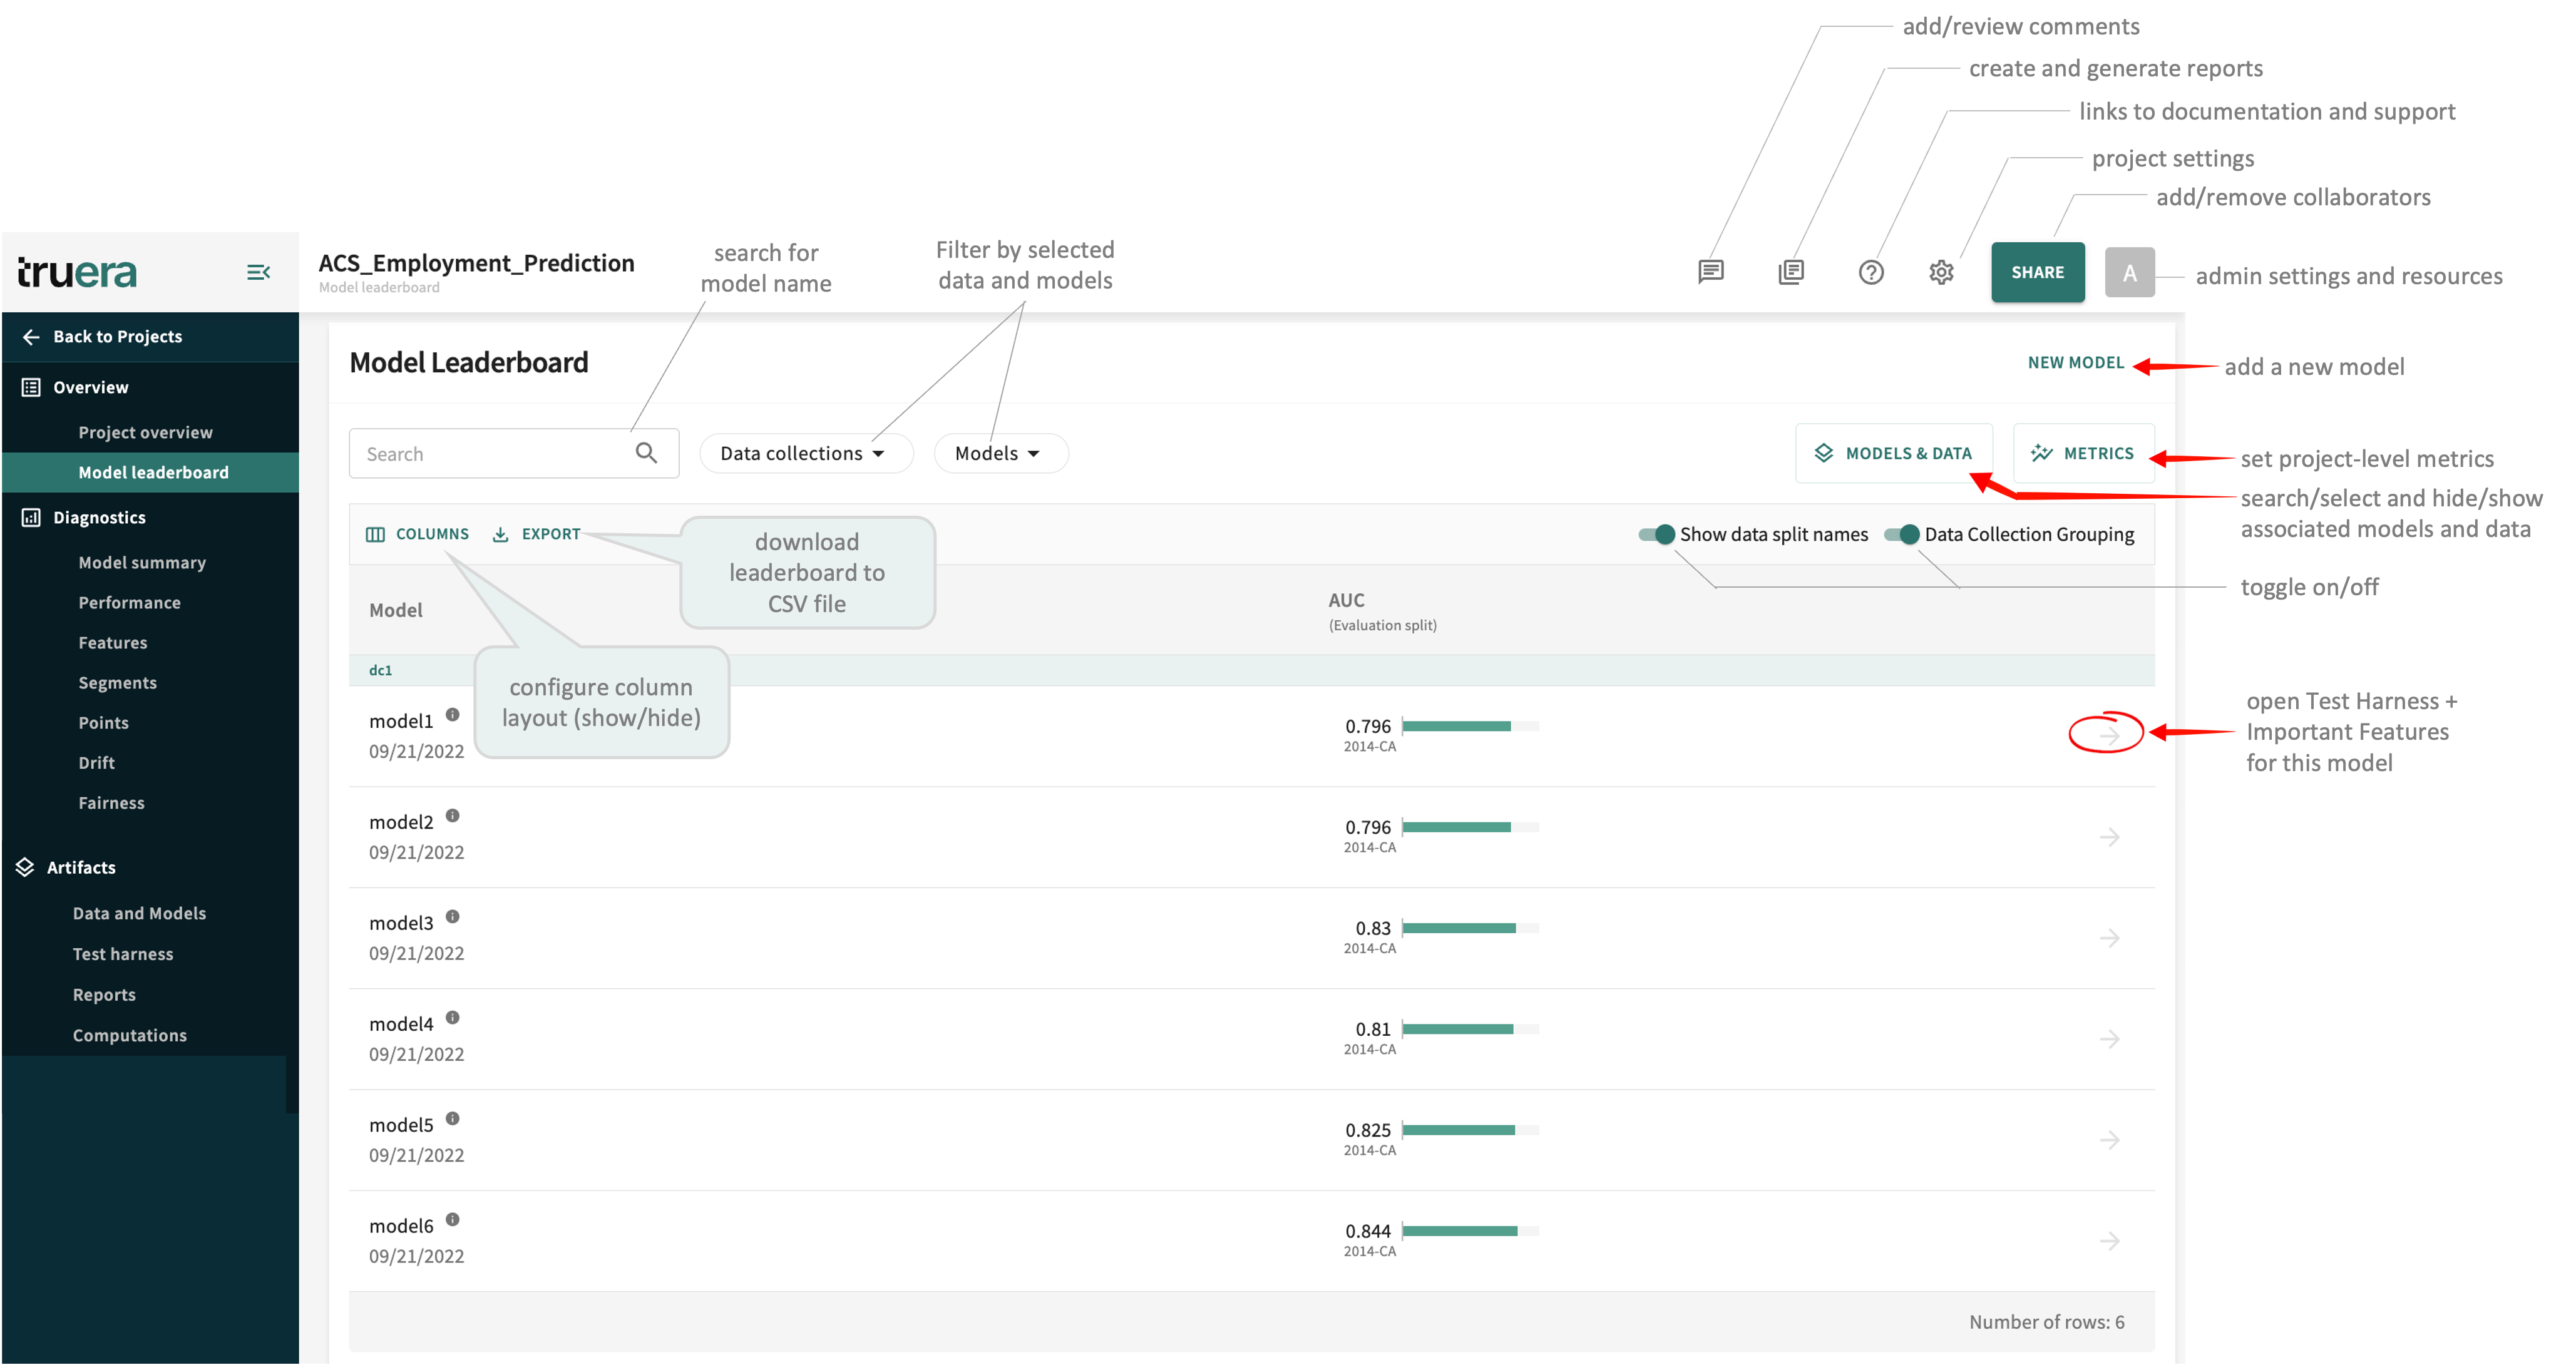
Of course, to view model results in the leaderboard, you'll first need to ingest one or more models.
Configuring the Leaderboard
You control what you want to display and prioritize. Initially, every model in the project is listed by name and the date it was created, along with its
AUC
. Area Under the Curve
The area bounded by the curve, the axis, and the boundary points.Search for a model by name, filter the list by Data Collections, select specific Models to track and the Evaluation split to apply, show/hide specific MODELS & DATA, and select the performance METRICS you want to track in your project.
Project-level Settings
You can set the data collection and split(s) track in the leaderboard by clicking MODELS & DATA. Select the performance metrics to apply by clicking METRICS. If you don't impose any selections, all models and the last split associated with them are used by default.
Leaderboard Models and Data
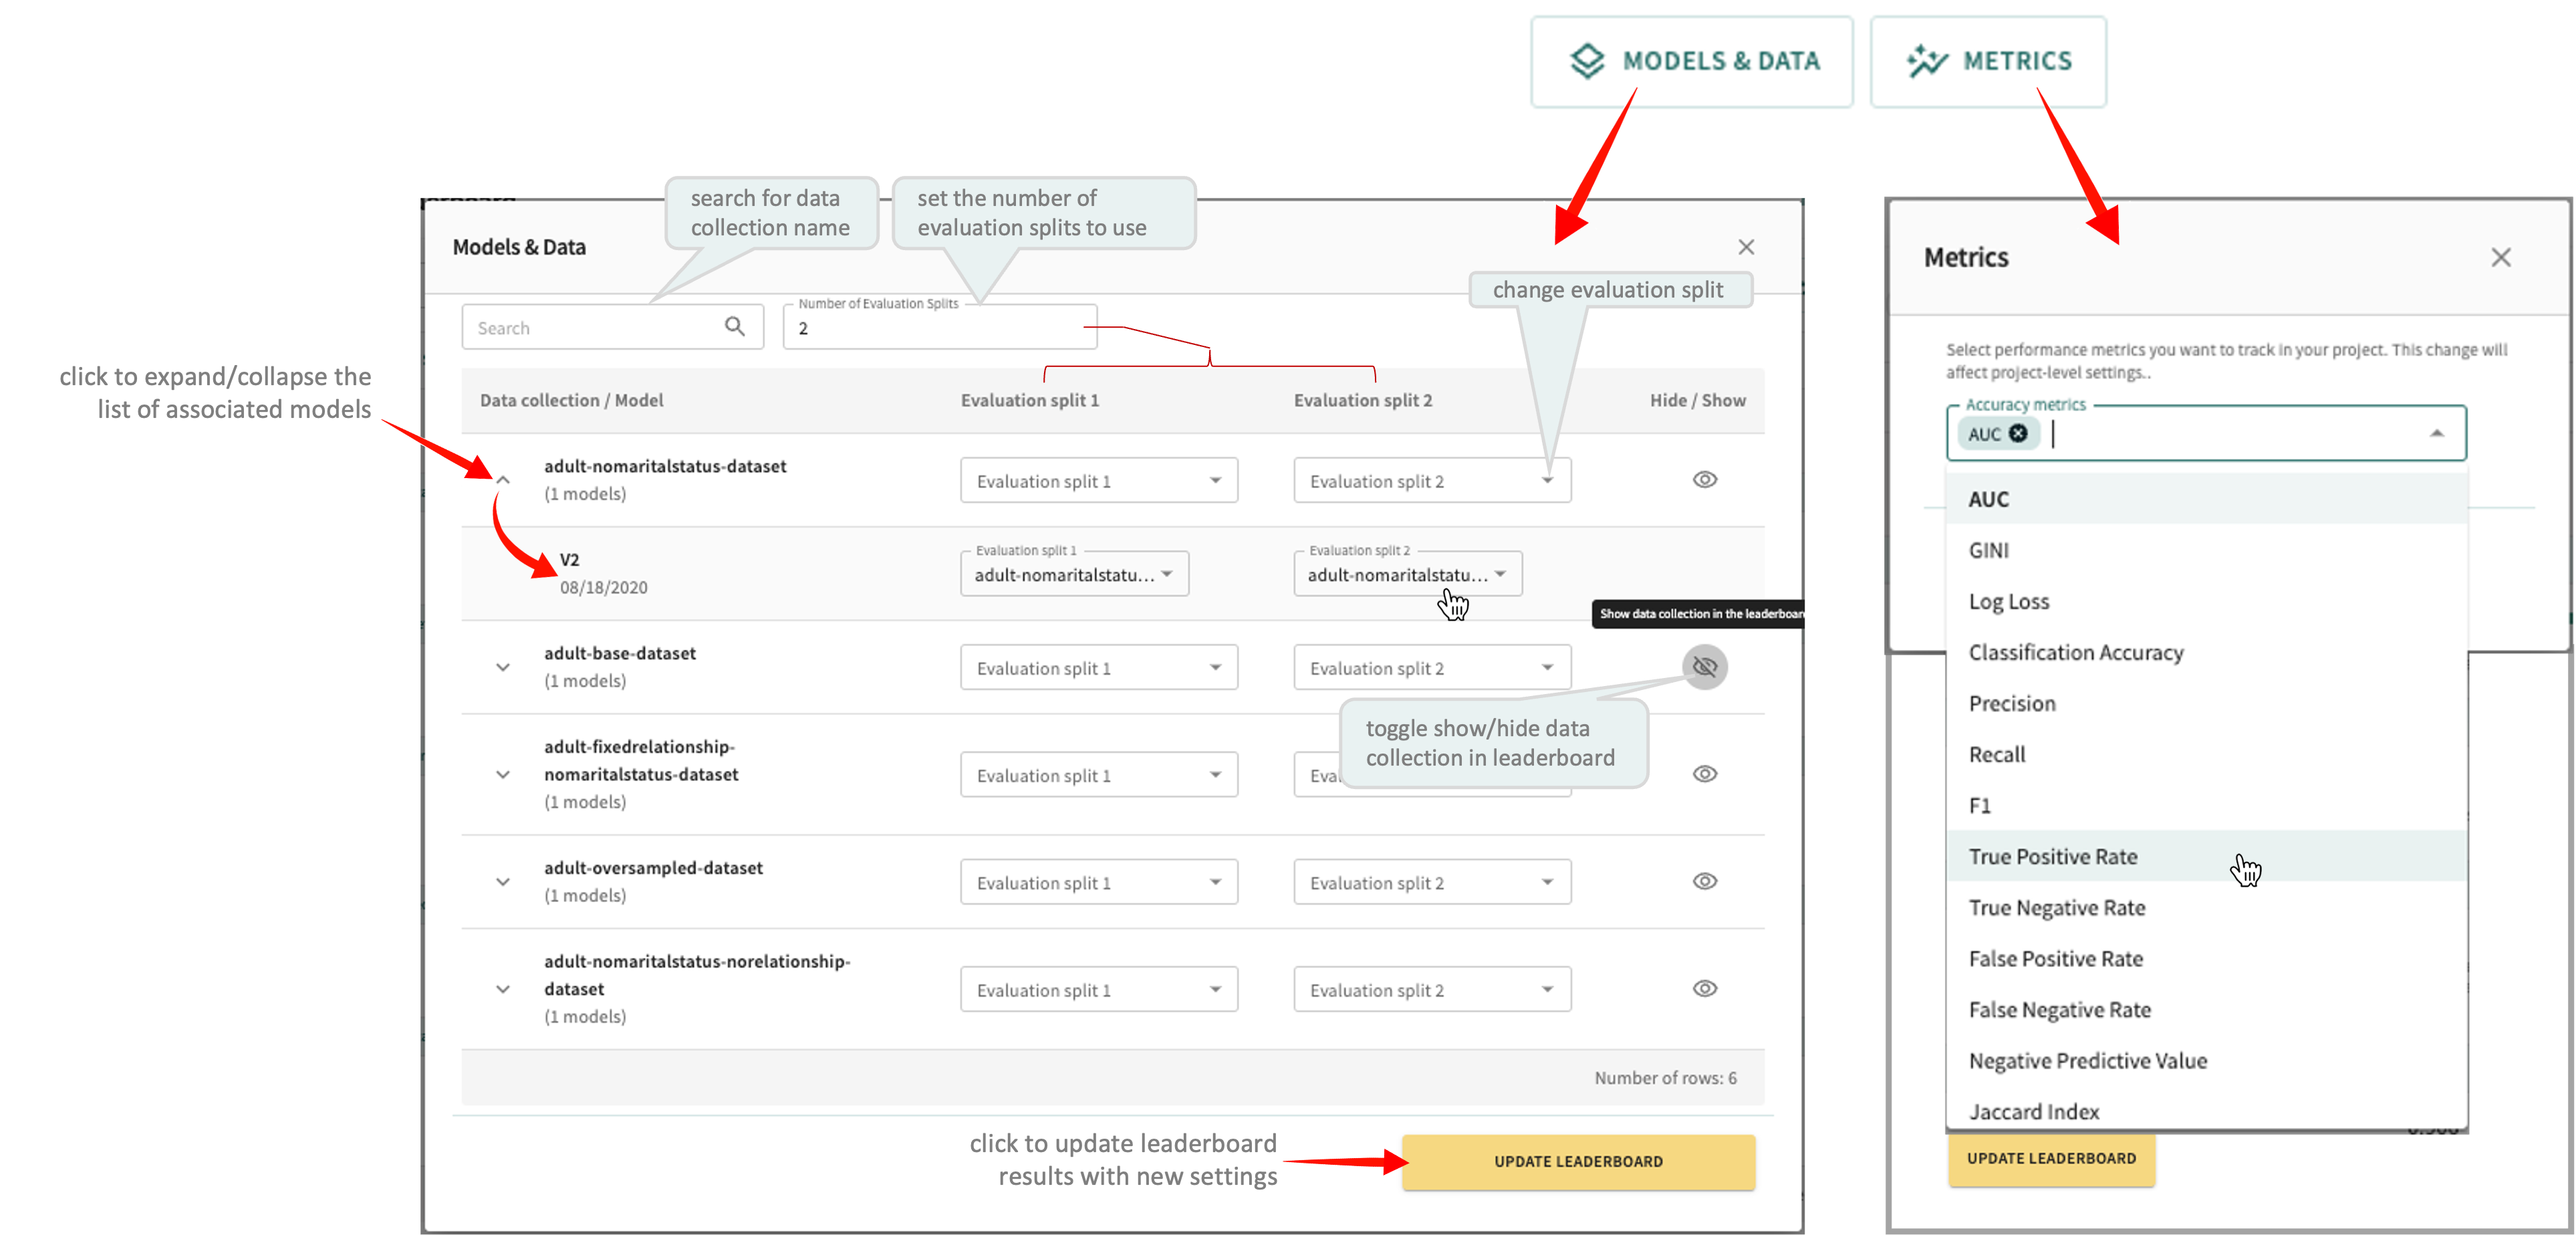
In the MODELS & DATA popup (pictured above), you set the Number of Evaluation Splits used for leaderboard tracking. Here, you can search for a particular Data collection to see the model(s) currently associated with it and choose to Hide/Show a Data collection and its models in the leaderboard.
Click UPDATE LEADERBOARD to see how your changes affect the model tracking results.
Leaderboard Performance Metrics
In the METRICS popup, click the Accuracy metrics listbox (pictured above) to select and apply one or more performance metrics from the list. See Supported Metrics for the complete list and definitions.
Click UPDATE LEADERBOARD to see how your changes affect leaderboard results.
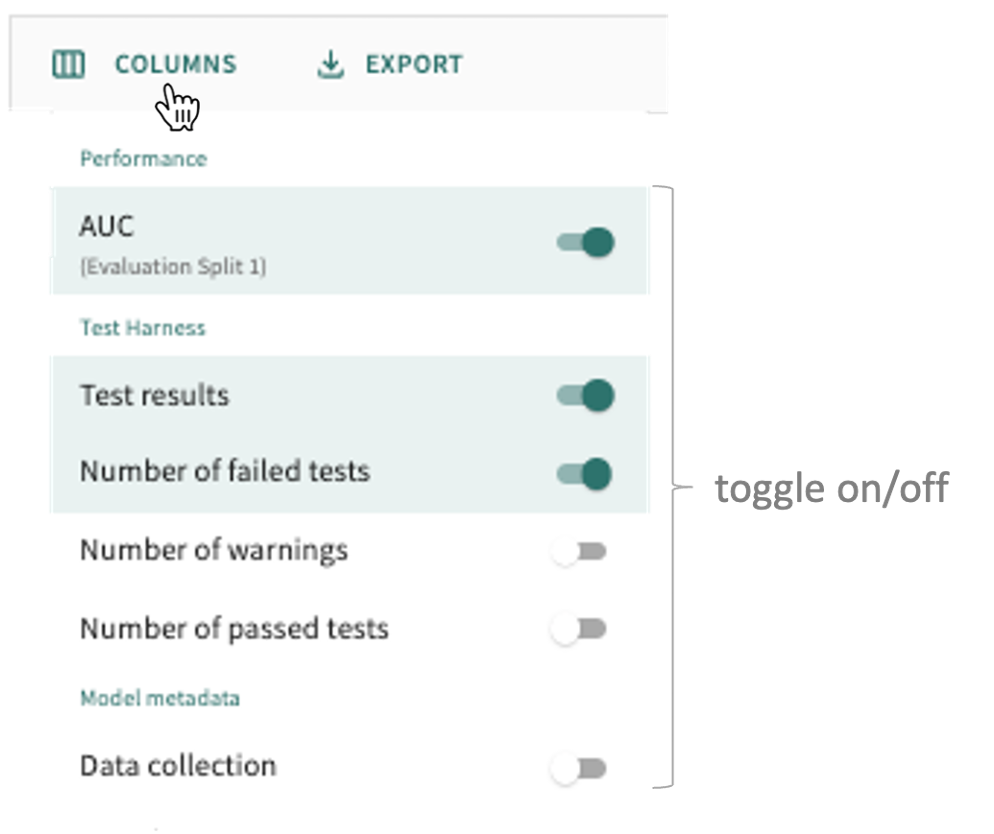
Leaderboard Layout
Configure the COLUMNS you want to display or wish to hide, then choose to Show split names and/or Group by Data Collection or hide them by toggling on/off the respective controls.
Of course, the leaderboard results displayed won't be meaningful until you've defined at least one model test to evaluate each model and then have TruEra compare the results.
You can do this for the model you want to test by clicking the arrow in the last column (to the right of the Test results column). This opens the Model Summary, where you can define model tests and view the latest results.
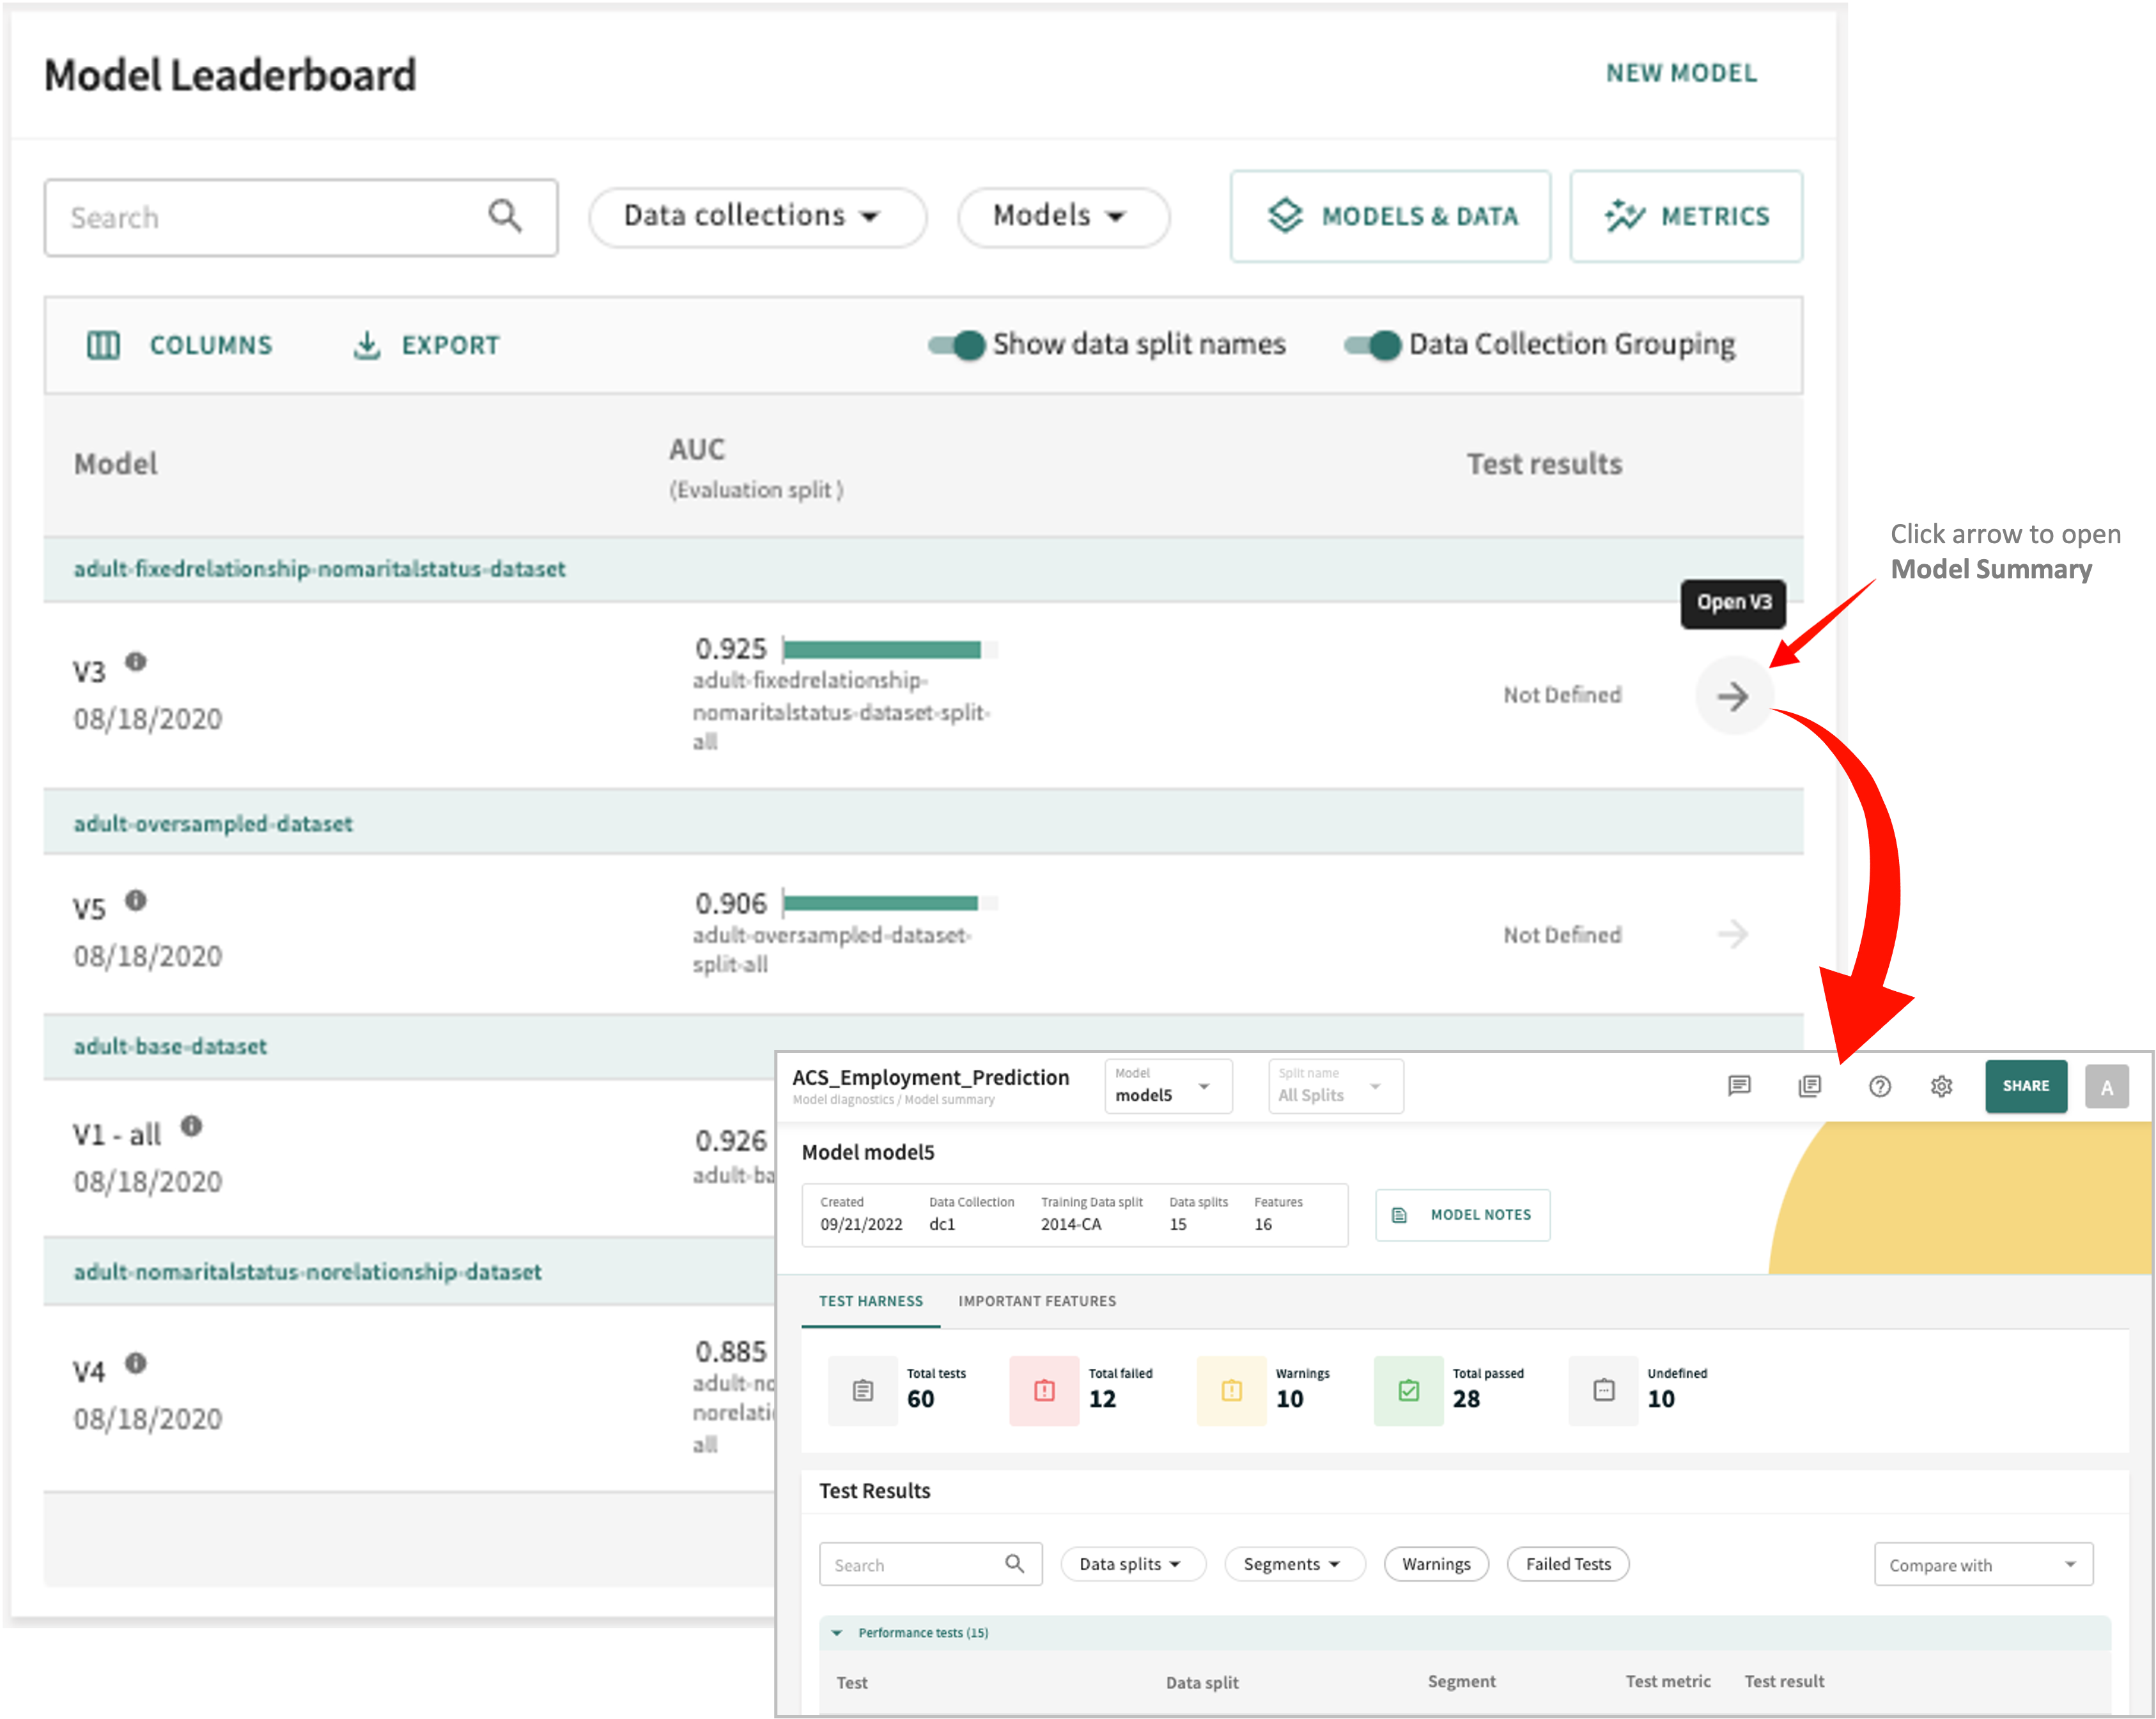
If no tests are defined, you'll receive a notification similar to the following:
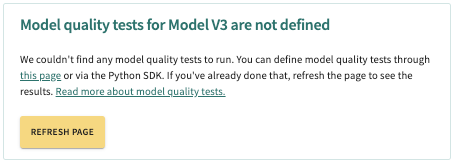
Either click the "this page" link in the notification or click Test harness under Artifacts in the Web App's left-side navigator. Both take you to the same destination.
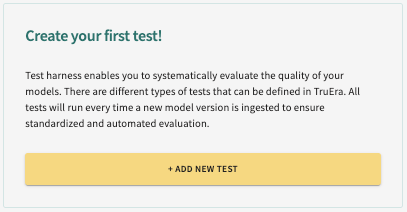
Click ADD NEW TEST to start a new model test definition.
Creating a New Test
Four test types are supported by TruEra's Test Harness:
- Performance tests – compute the correctness and accuracy of model predictions on a set of data by evaluating it against user-defined metrics and thresholds.
- Fairness tests – compute the fairness or bias in the model toward a protected class by evaluating it on a set of data against user-defined metrics and threholds.
- Stability tests – computes the model score drift between two sets of data by evaluating it against user-defined metrics and thresholds.
- Feature Importance tests – computes the number of features that have an importance less than the minimum number defined by the user, comparing that number against a threshold.
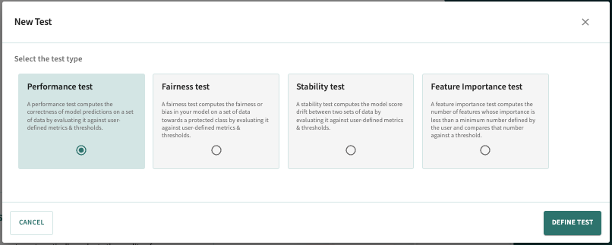
Click the test type you want to define, then click DEFINE TEST.
Choose from one of the following links for guidance on setting up the respective test type:
Click Next below to continue.