Changing Dashboard Display Settings
After you've created a dashboard, you can still control the selected models and time range displayed for monitoring. Just click EDIT near the top of the page.
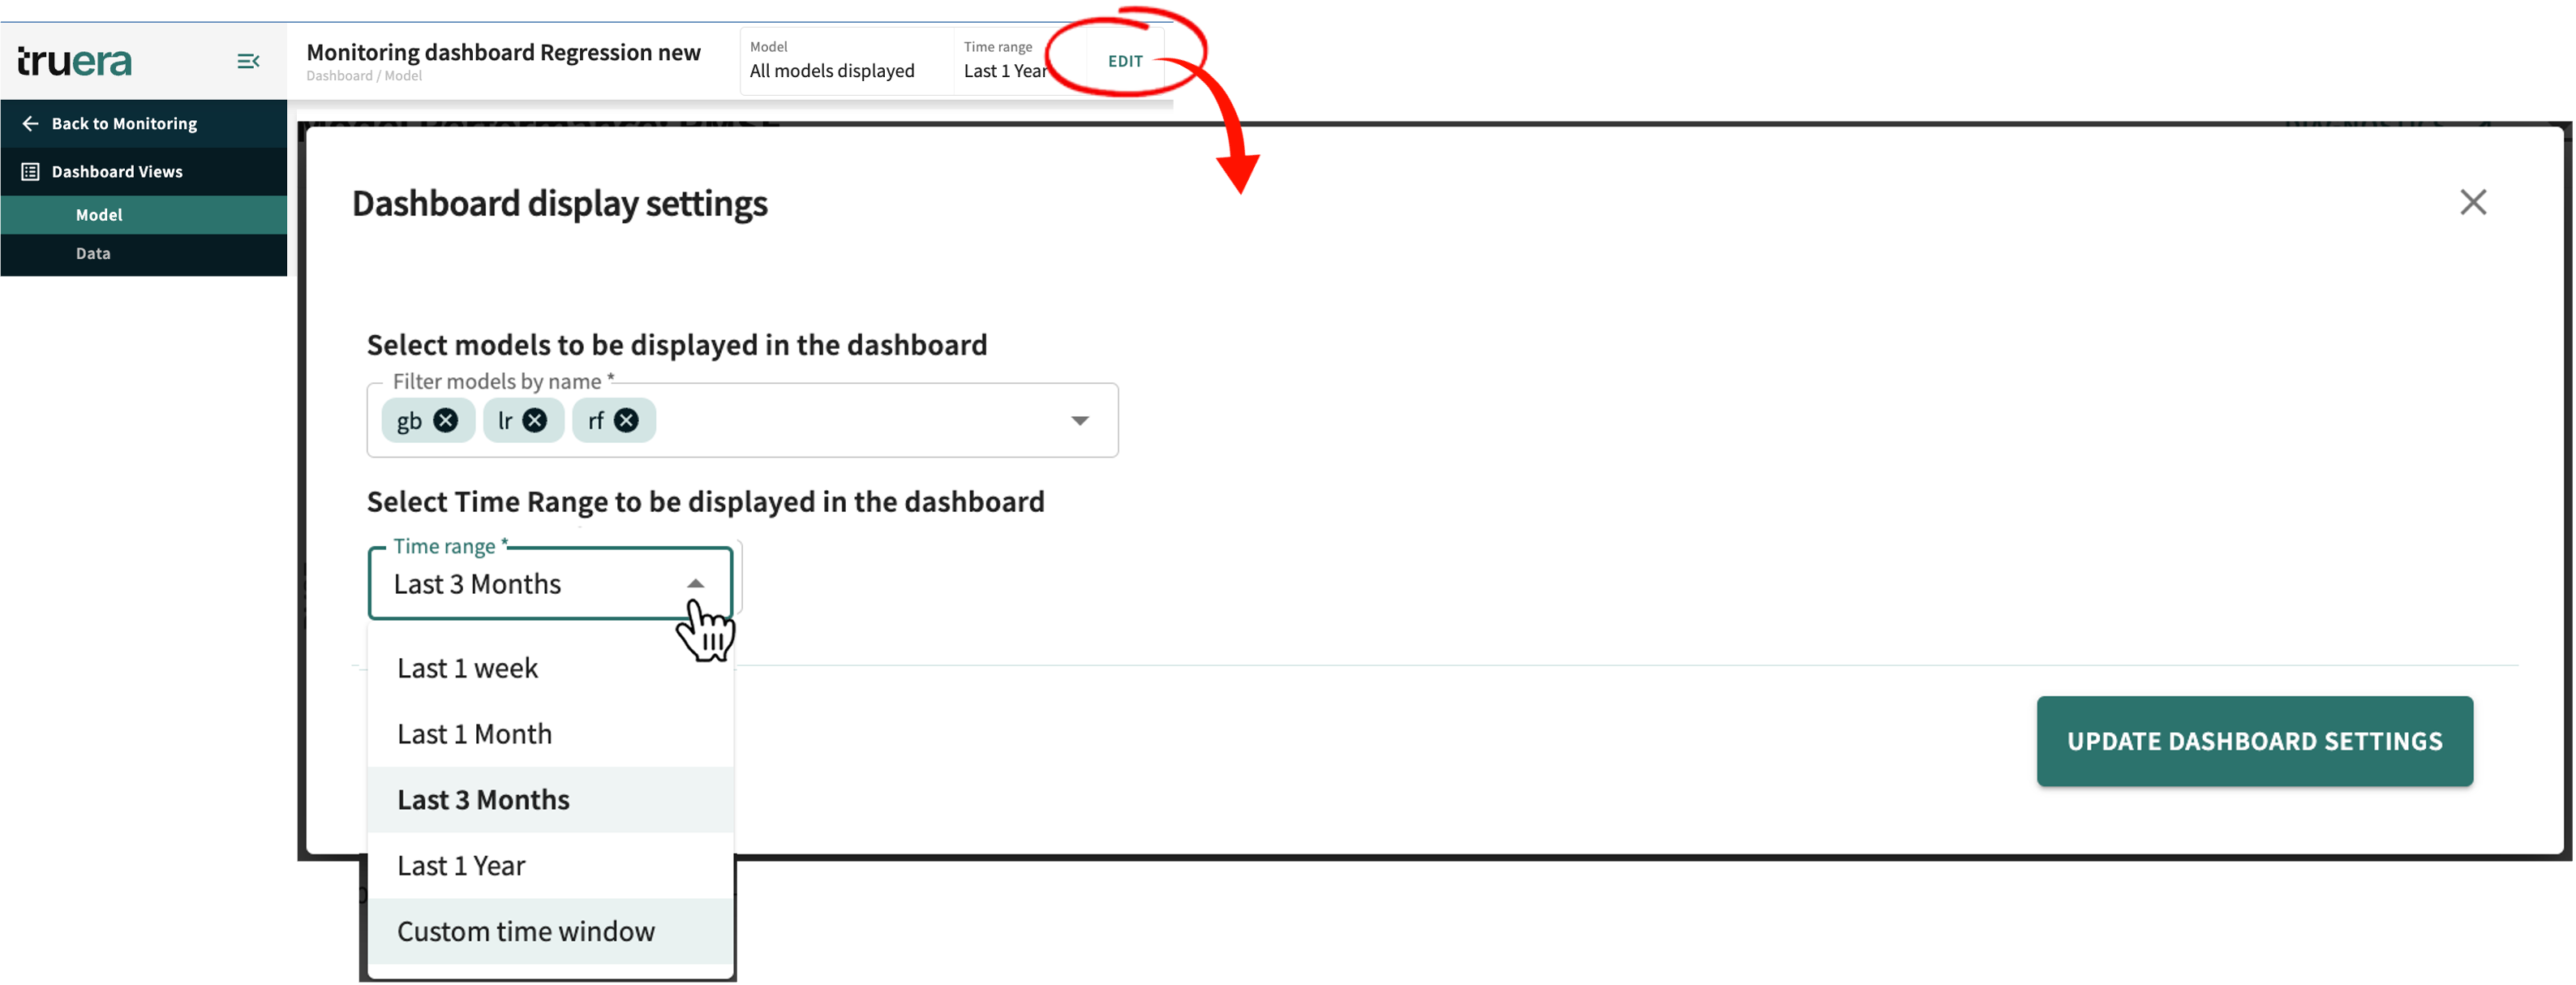
Whatever is selected in terms of models and time ranges will be displayed in all configured panels.
Changing the Dashboard Panel Configuration
You can change the panel configuration for a dashboard by clicking CANCEL (X-ing out of Dashboard display settings), then clicking ← Back to Monitoring. See Step 3 in Creating/Changing a Dashboard for guidance concerning selecting/changing dashboard panels.
To change the models to display:
- Open Dashboard display settings (click EDIT at the top of the dashboard view).
-
Select one or more models from the drop-down list.
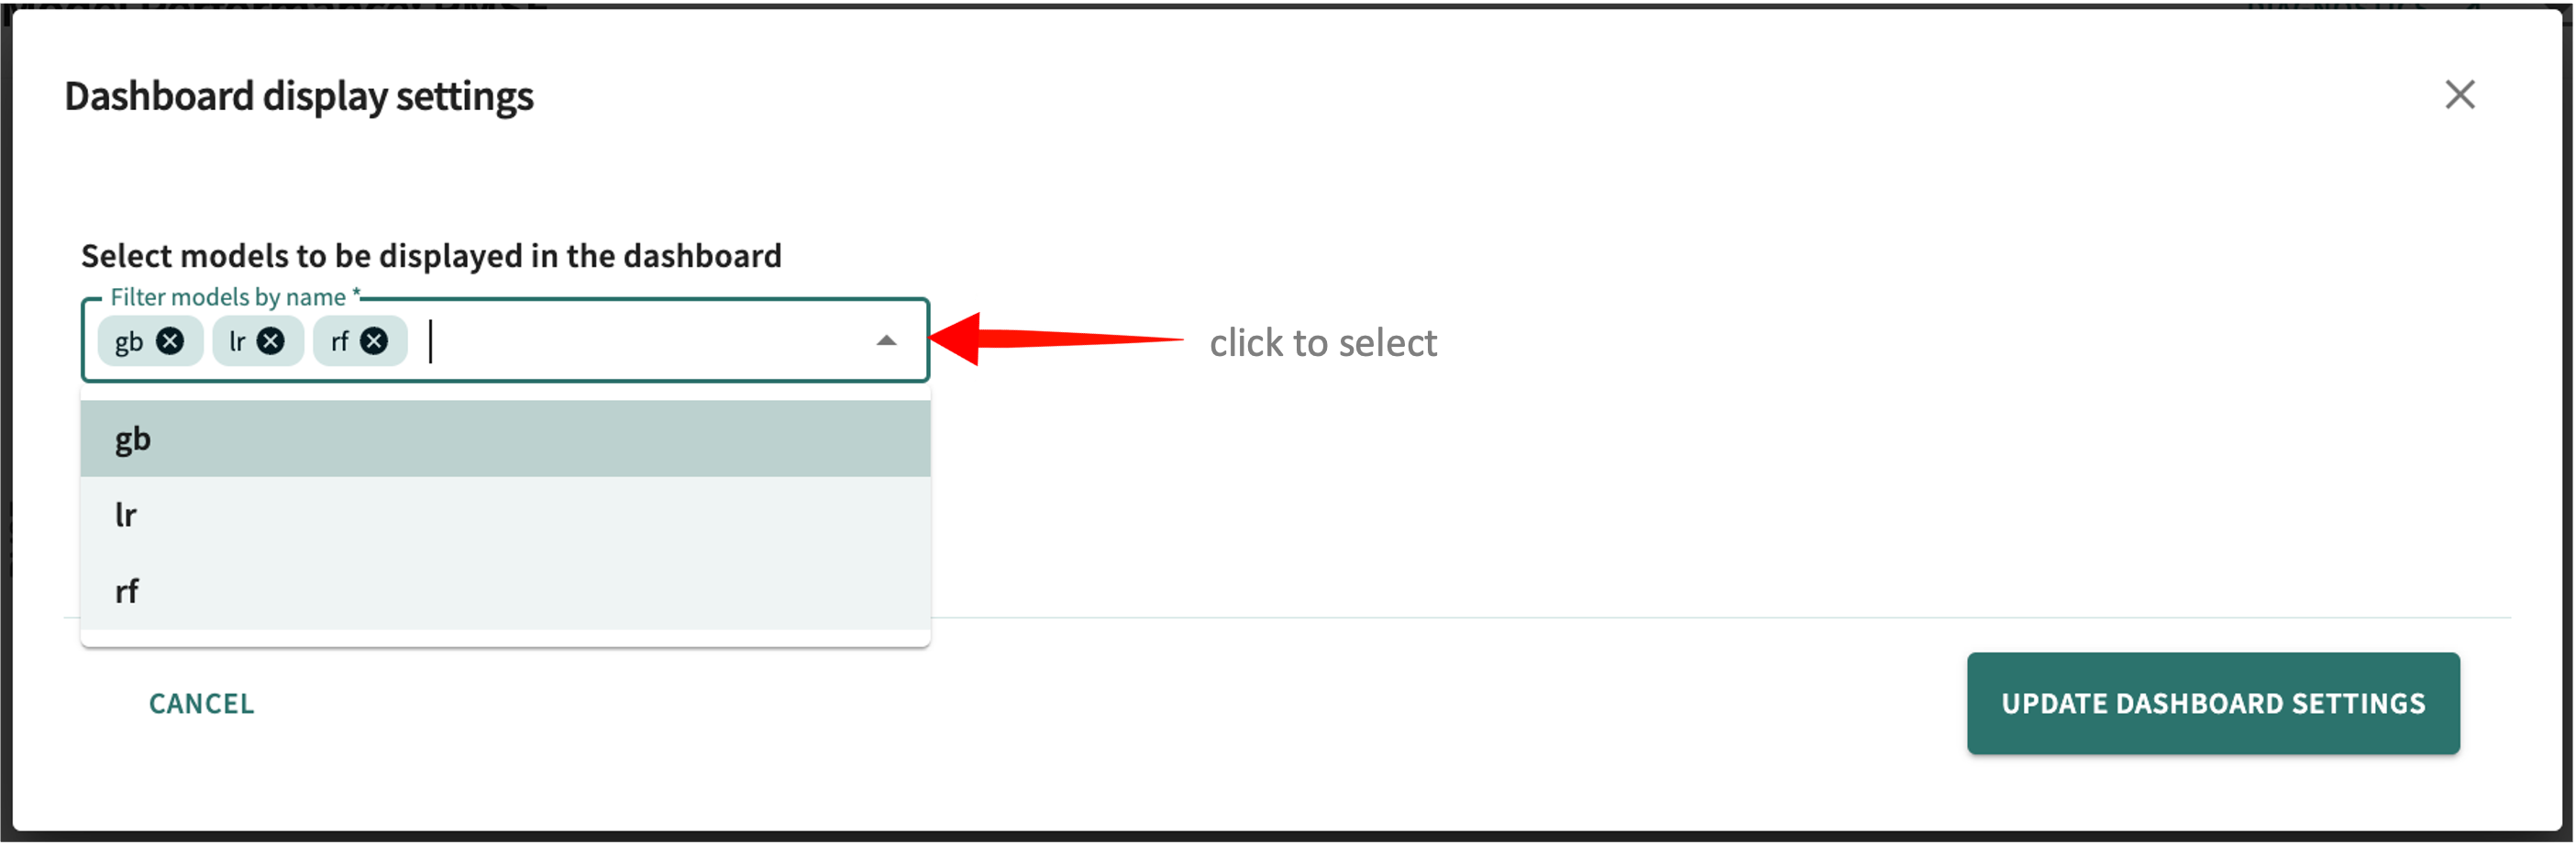
click and hold to enlarge The list is limited to the models included when the dashboard was last edited. Remove selected models by clicking its .
To change the time range:
-
Click the Time range listbox and choose one of the available options.
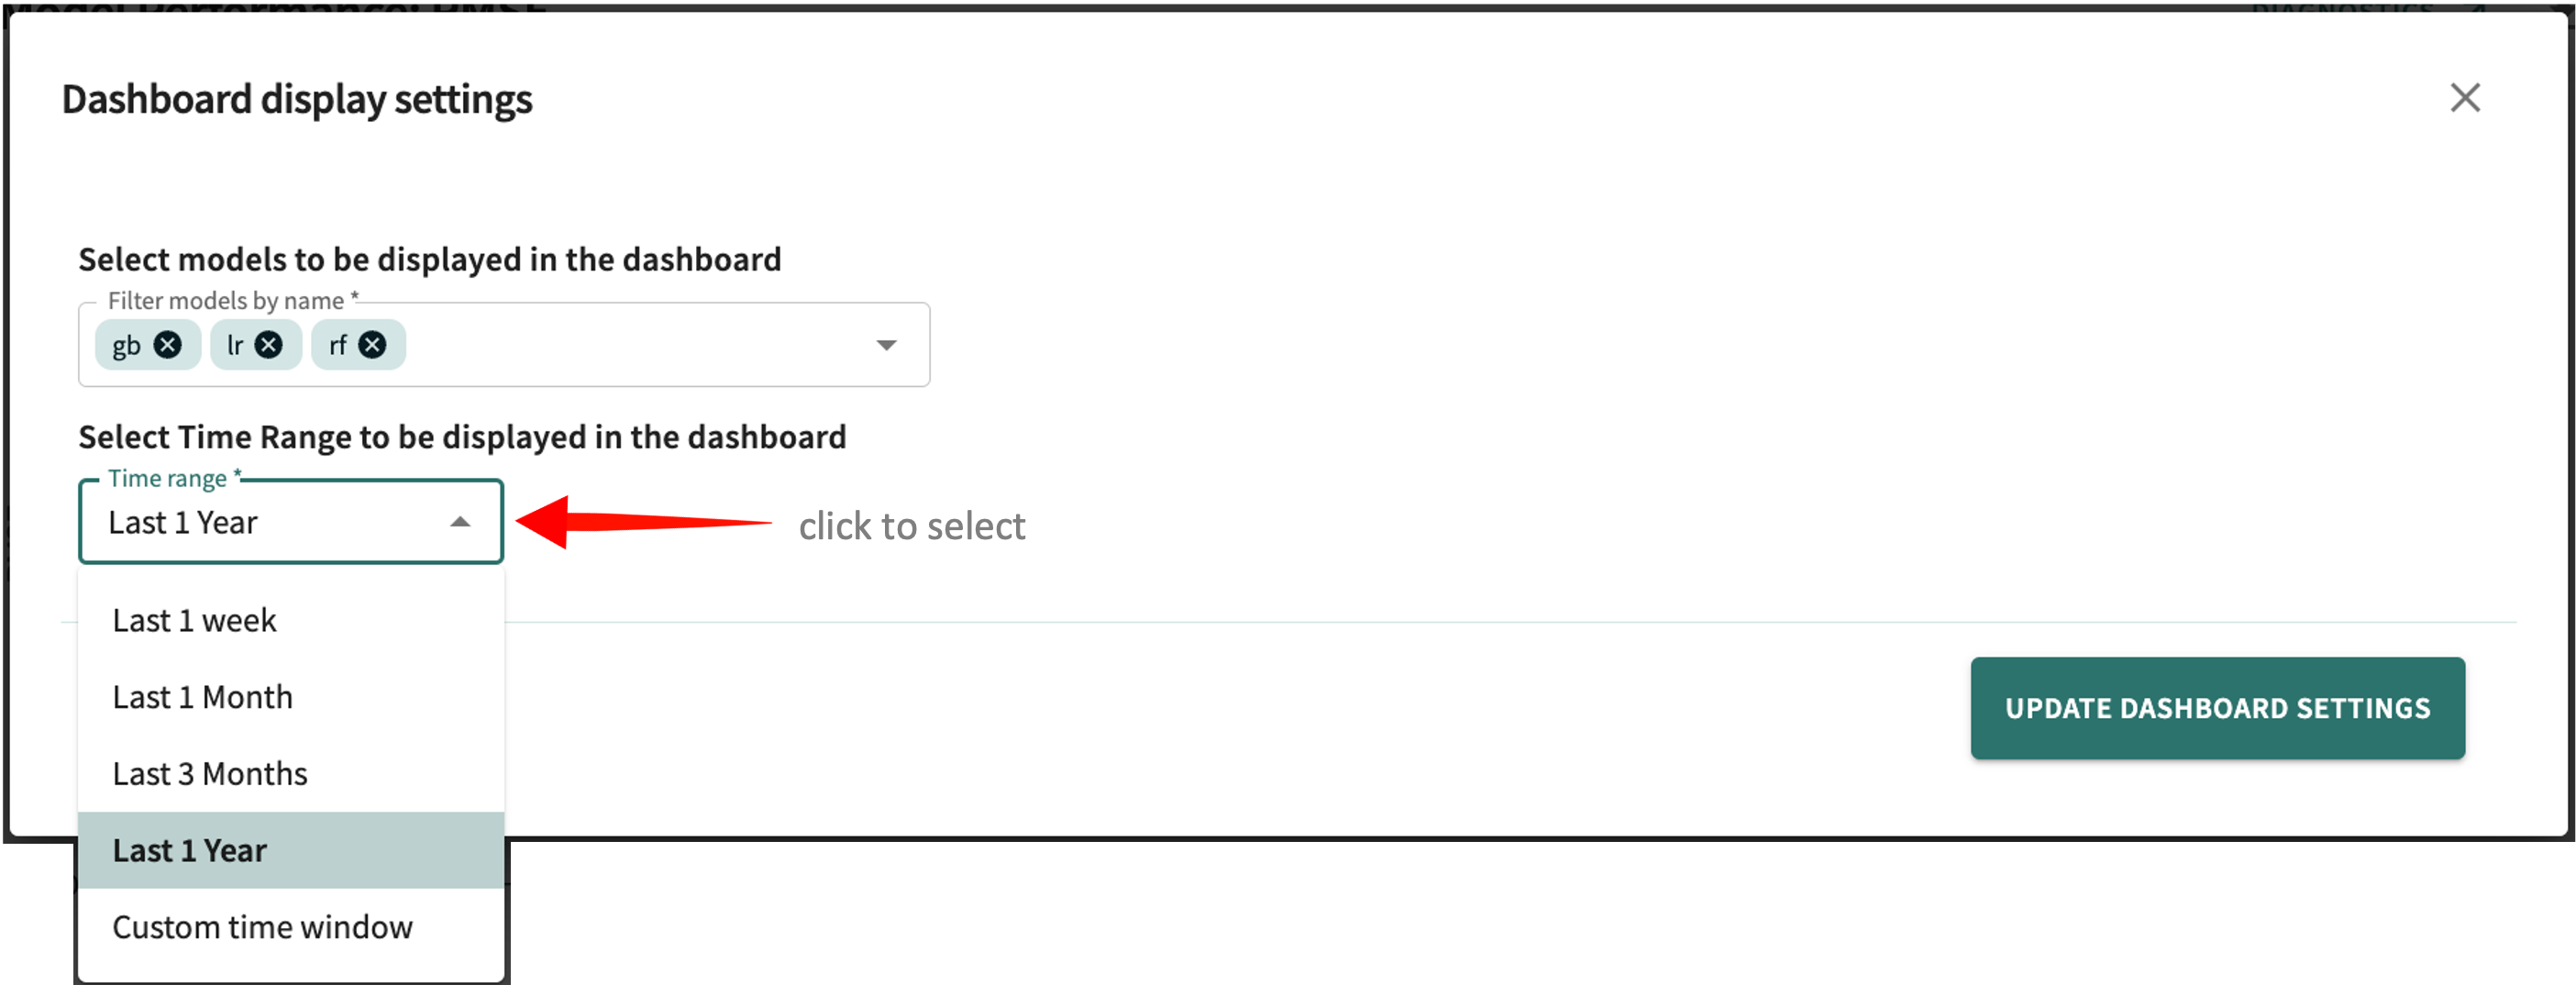
click and hold to enlarge All of your choices have a start relative to the current date, except for the last one — Custom time window — for which you must specify both a Start date and an End date.
-
If you select Custom time window, choose a Start date and an End date from the calendar widget.
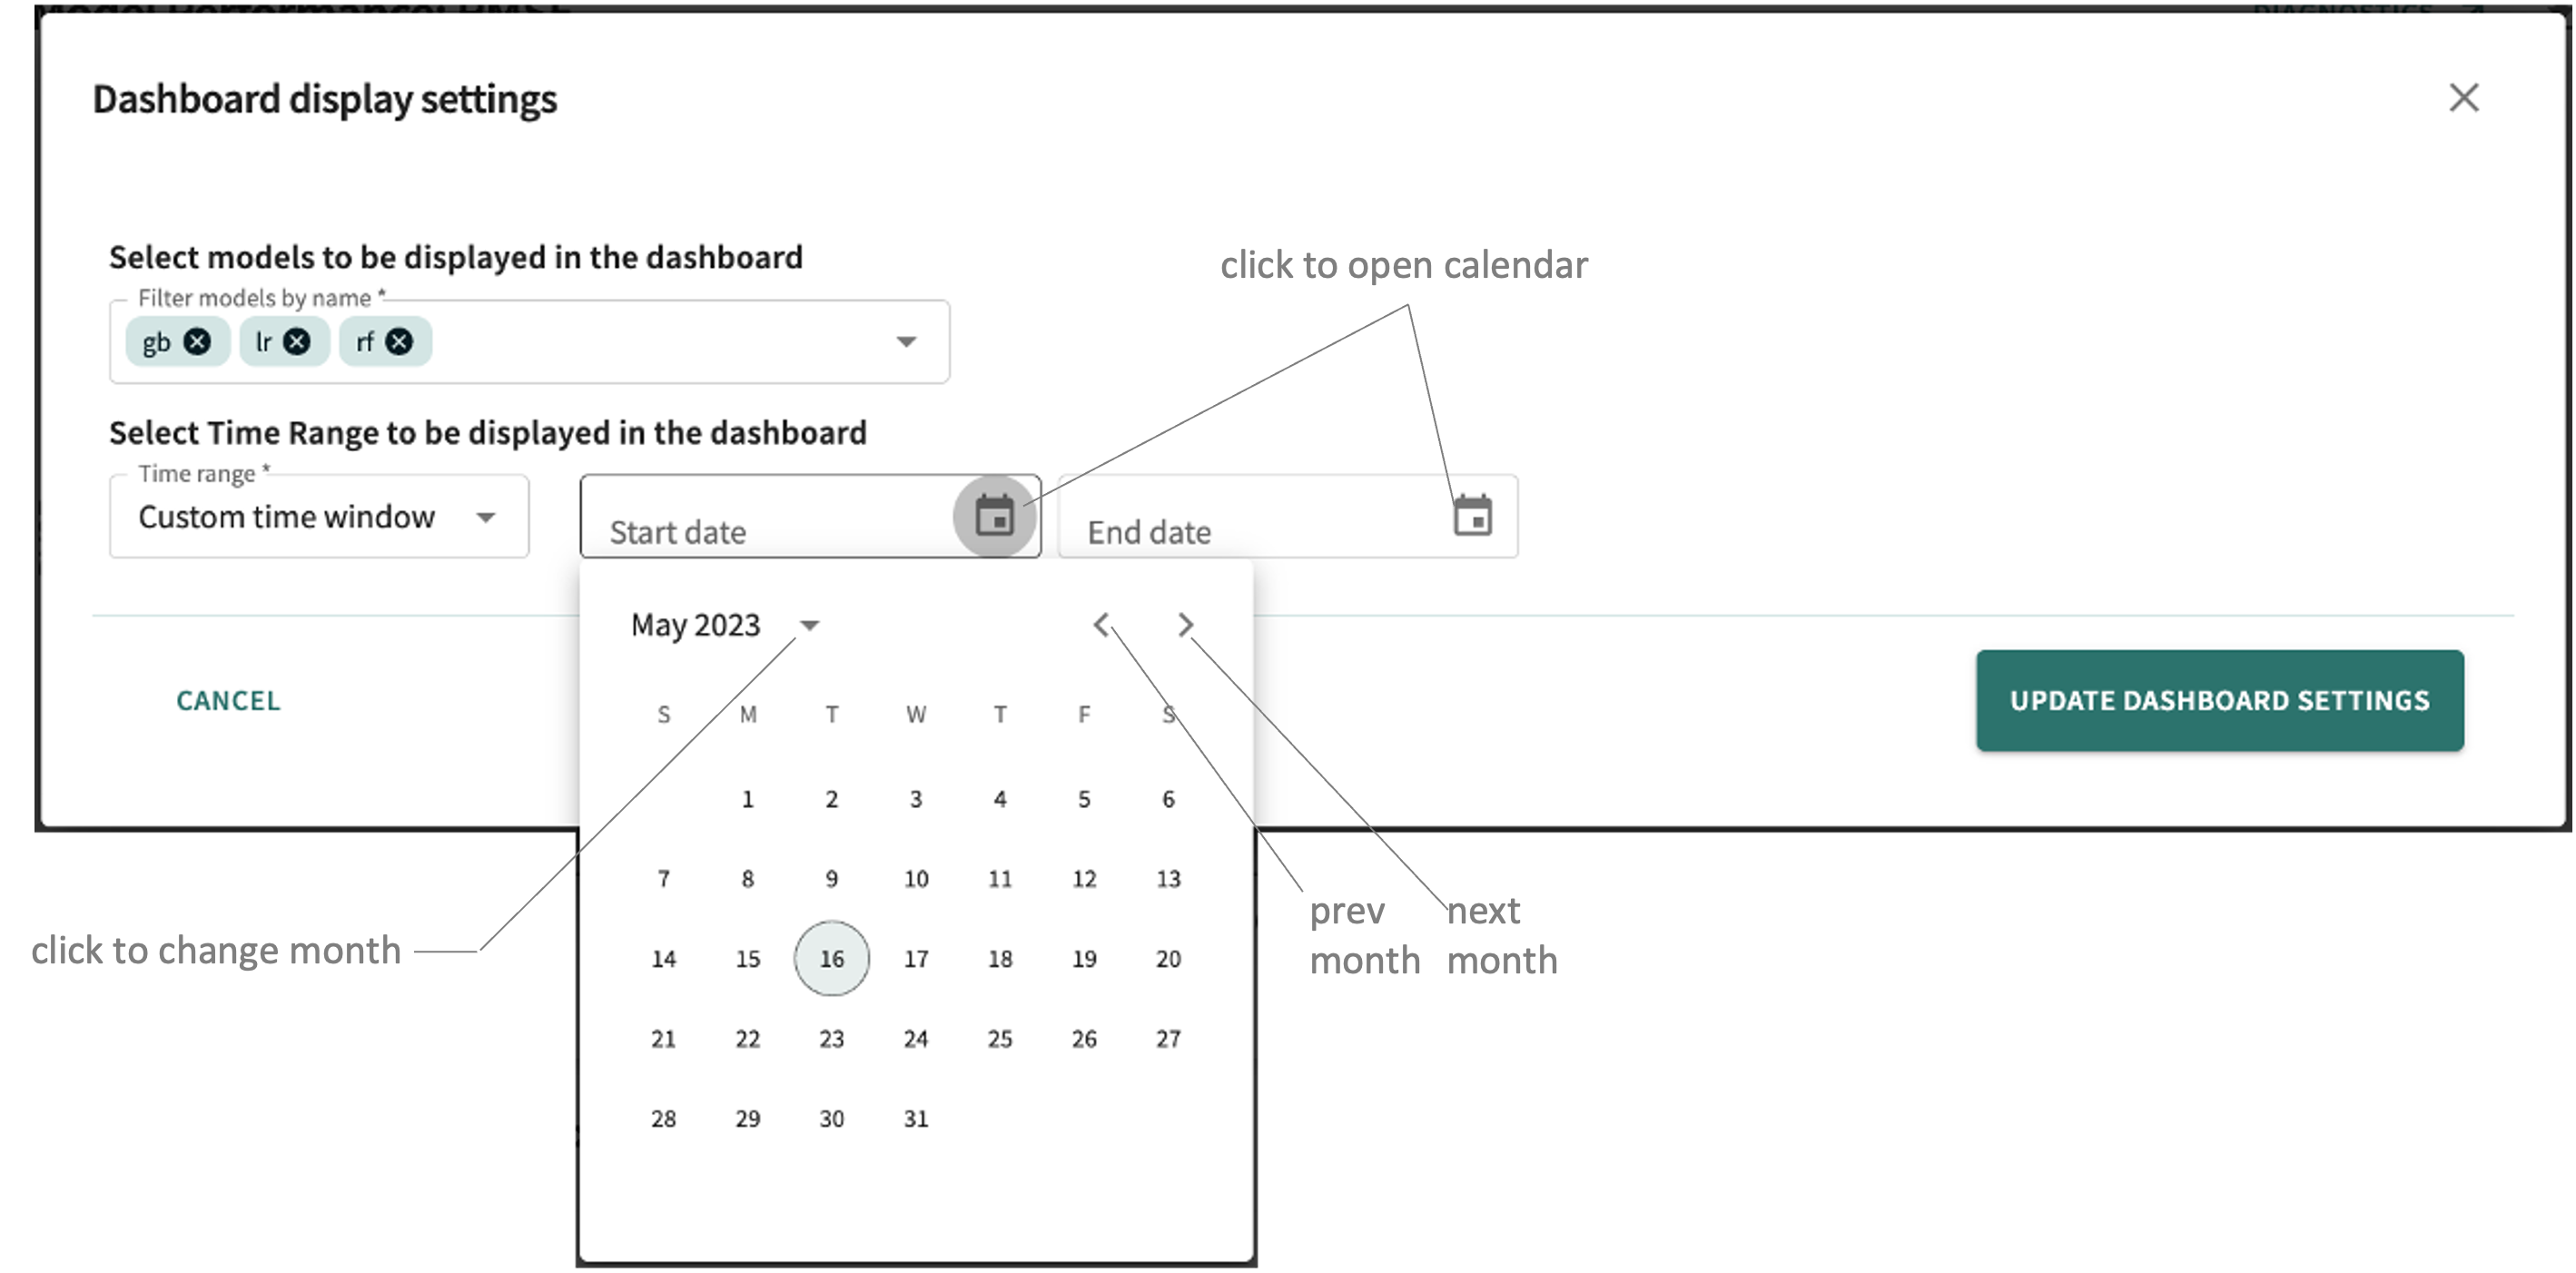
click and hold to enlarge
Click UPDATE DASHBOARD SETTINGS so your panel displays reflect the new settings.
Click Next below to continue.