Interesting/High-Error Segments: Finding Hotspots
Useful for identifying and isolating interesting and/or high-error data points in order to take targeted, corrective measures during model performance debugging is an analytical technique called Segmentation. It entails dividing and organizing (segmenting) your data into defined groups having one or more characteristics in common to find points at variance with overall model output.
However, manually sifting through a large or small data split for points that can be construed as "interesting" or "high-error" is a time-consuming and often cumbersome task requiring a lot of choices along the way, starting with what constitutes "interesting" and how high is a "high" error rate? In other words, what is your segmentation criteria? Which features should be included that share a value or fall within a particular range?
The TruEra Python SDK's find_hotspots() method simplifies and automates precisely this type of manual exploration.
How does it work?
Given user-specified parameters, find_hotspots() searches features or sets of features in a greedy fashion to return segments that maximize or minimize the "metric of interest" you specify.
Note
Here, the term "hotspots" is interchangeable with "interesting/high error segments.
Pointwise Metric Calculation
To calculate a given metric on various segments in a split, it's necessary to establish a pointwise metric over which to aggregate. This could be, for example:
-
Pointwise classification accuracy – assign the value of 1 to correctly classified points; assign all other points a value of 0.
-
Pointwise squared error – assign the squared difference between its prediction and its ground truth to each point.
-
Pointwise precision – two lists are maintained, numerator and denominator; points belonging to either list are assigned a value of 1; all other points receive a value of 0.
Pointwise metrics can then be aggregated for various segments, allowing a comparison across different segments in order to return the most “interesting” ones; where “interesting” correlates to higher or lower depending on the metric of interest.
Pointwise Metric Aggregation: Simple Mean
Aggregation of pointwise metrics depends on the metric of interest. For aggregated metrics expressed as the mean of the pointwise metrics, TruEra uses the approach cited next.
Denoting a set of model predictions on a segment as S of size │S │ = Nsegment and P(x1) as the pointwise metric for the i-th point in the segment, the aggregated metric for a segment can be given as:
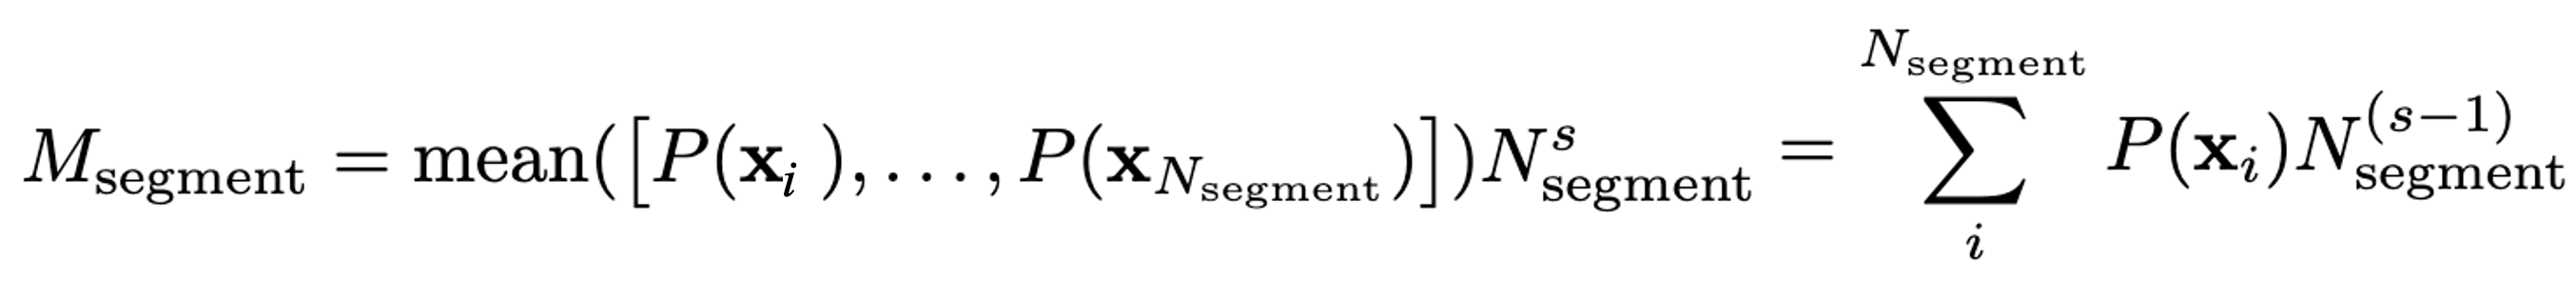
where s is the 'size exponent' factor to help scale Msegment by the size of the segment.
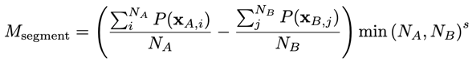
If a comparison_data_split_name is provided, here's the mean aggregation used:
Denoting split A and split B as the base and comparison splits, respectively, then denoting the size of the segment in these splits as NA and NB, the aggregated mean metric can be given as
Pointwise Metric Aggregation: Confusion Matrix
With respect to metrics derived from the confusion matrix (e.g., precision, recall, true/false positive/negative rate), the aggregation method must take into account the numerator and the denominator of the metric of interest. For instance, if the definition of precision is
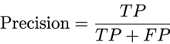
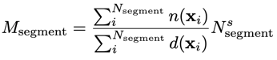
then the pointwise metrics denote membership in the numerator (e.g., TP for Precision) and the denominator (e.g., TP + FP for Precision) of the corresponding confusion matrix metric. Therefore, the aggregated metric for the given segment is derived by
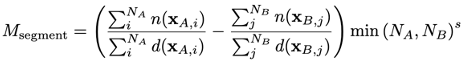
Denoting a set of model predictions on a segment as S of size │S │ = Nsegment and functions n(xi) (d(xi)), which indicate numerator (denominator) membership of the i-th point in the segment, the aggregated metric for a segment can then be given as
If a comparison_data_split_name is provided, then the following numerator/denominator aggregation is used.
Denoting the size of the segment in the split as NA and NB, the aggregated mean metric can be given as:
Parameters
Although the find_hotspots() method definition in the Python SDK Technical Reference provides the full list of parameters, here is some additional context:
-
size_exponent– float in range [0,1] which encourages the method to return smaller segments. Looking at the equation above, we see thatsize_exponent = 0results in the mean value over the segment whilesize_exponent = 1results in the sum of the pointwise metrics in the segment. -
comparison_data_split_name– defaults toNone; required formetric_of_interest = UNDER_OR_OVER_SAMPLING; optional for any other metric of interest. -
metric_of_interest– name of metric to use when searching for hotspots. Allowable values for different project types are listed in the tables that follow for classification and regression projects, respectively.
Classification Metrics of Interest
| Metric | Description | Notes |
|---|---|---|
SEGMENT_GENERALIZED_AUC |
common threshold-independent metric | default |
CLASSIFICATION_ACCURACY |
common classification metric | |
LOG_LOSS |
threshold-independent metric | |
PRECISION |
confusion-matrix derivative metric | |
RECALL |
confusion-matrix derivative metric | |
TRUE_POSITIVE_RATE |
confusion-matrix derivative metric | |
FALSE_POSITIVE_RATE |
confusion-matrix derivative metric | |
TRUE_NEGATIVE_RATE |
confusion-matrix derivative metric | |
FALSE_NEGATIVE_RATE |
confusion-matrix derivative metric | |
UNDER_OR_OVERSAMPLING |
model-agnostic, data-dependent | experimental* |
Regression Metrics of Interest
| Metric | Description | Notes |
|---|---|---|
MEAN_ABSOLUTE_ERROR |
common regression metric | default |
MEAN_SQUARED_ERROR |
common regression metric | |
MEAN_SQUARED_LOG_ERROR |
useful when range of target is large | |
UNDER_OR_OVERSAMPLING |
model-agnostic, data-dependent | experimental* |
Under/Oversampling Metric of Interest (Experimental)
HIGH_UNDER_OR_OVERSAMPLING is a data-dependent metric of interest TruEra exposes to search for interesting segments based on the percentage difference between segment sizes in two data splits. Please note that this metric requires a comparison split in addition to the explainer’s base split.
An under/oversampled segment will have a high size diff (%) value, which is the absolute difference between segment sizes as a percentage of split sizes formally defined as:
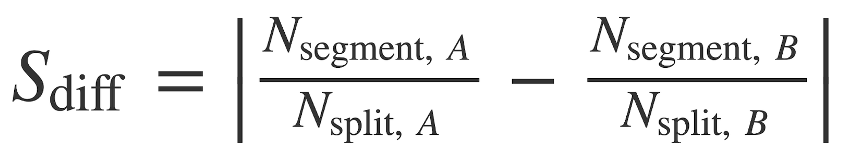
where A and B denote two splits to compare, Nsegment denotes the number of points in the segment, and Nsplit denotes the number of points in the split.
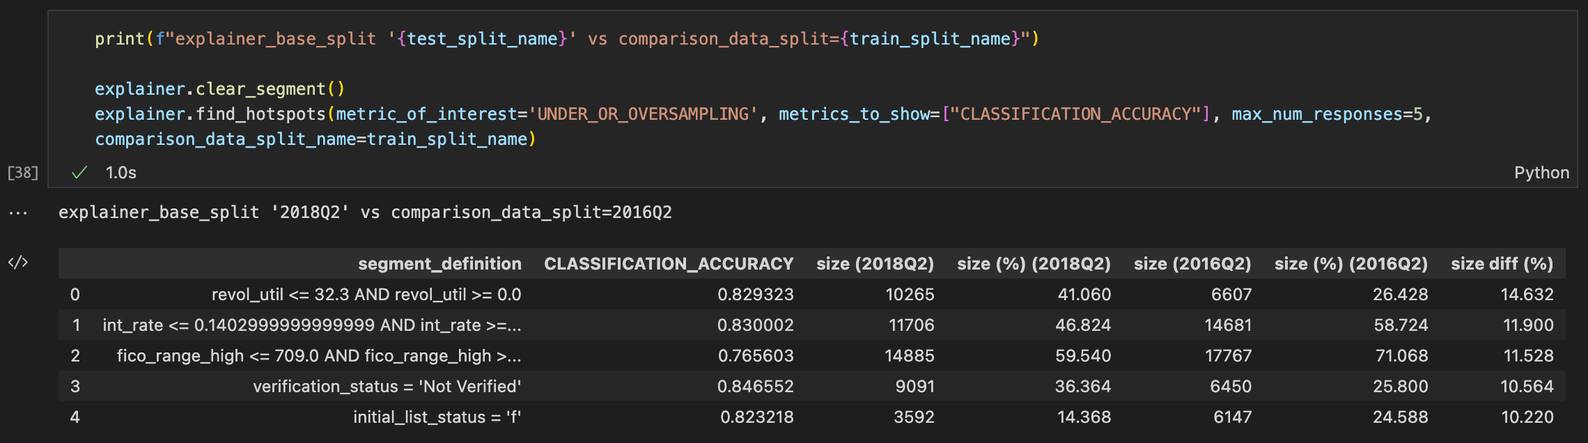
Hence, the output of find_hotspots() when metric_of_interest=UNDER_OR_OVERSAMPLING will look similar to this:
Important
The find_hotspots() method requires that a model is defined on the explainer, even though calculating UNDER_OR_OVERSAMPLING does not require a model.
"What If" Metric (Experimental)
At one point or another, you'll undoubtedly ask yourself whether it's worth your time to take action on these "interesting" segments. To help you assess a proposed segment's actionability, TruEra denotes a ‘what if’ metric as:
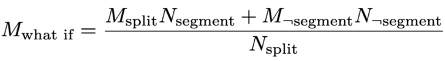
where M denotes the metric on a set of points and N denotes the number of points.
An abstract of the "what if" metric calculation looks like this:
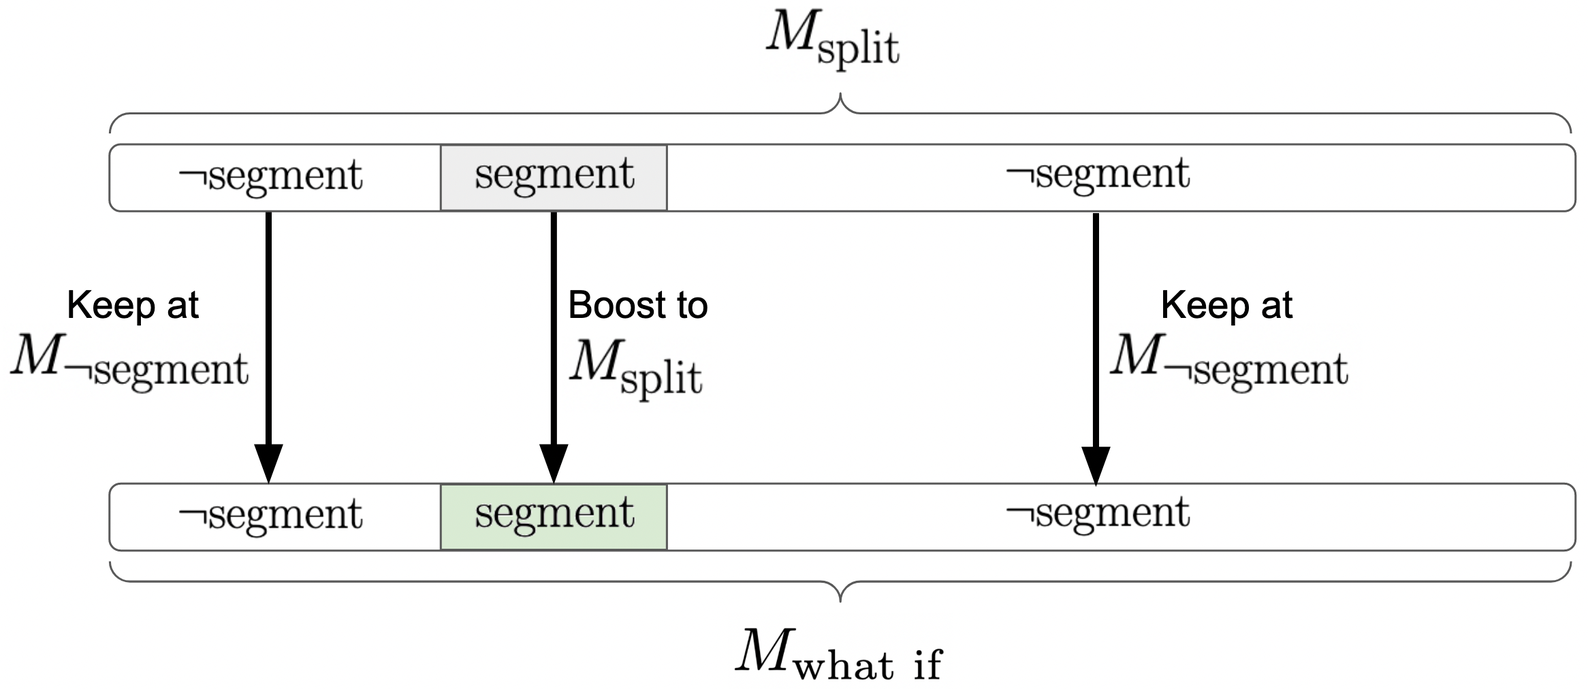
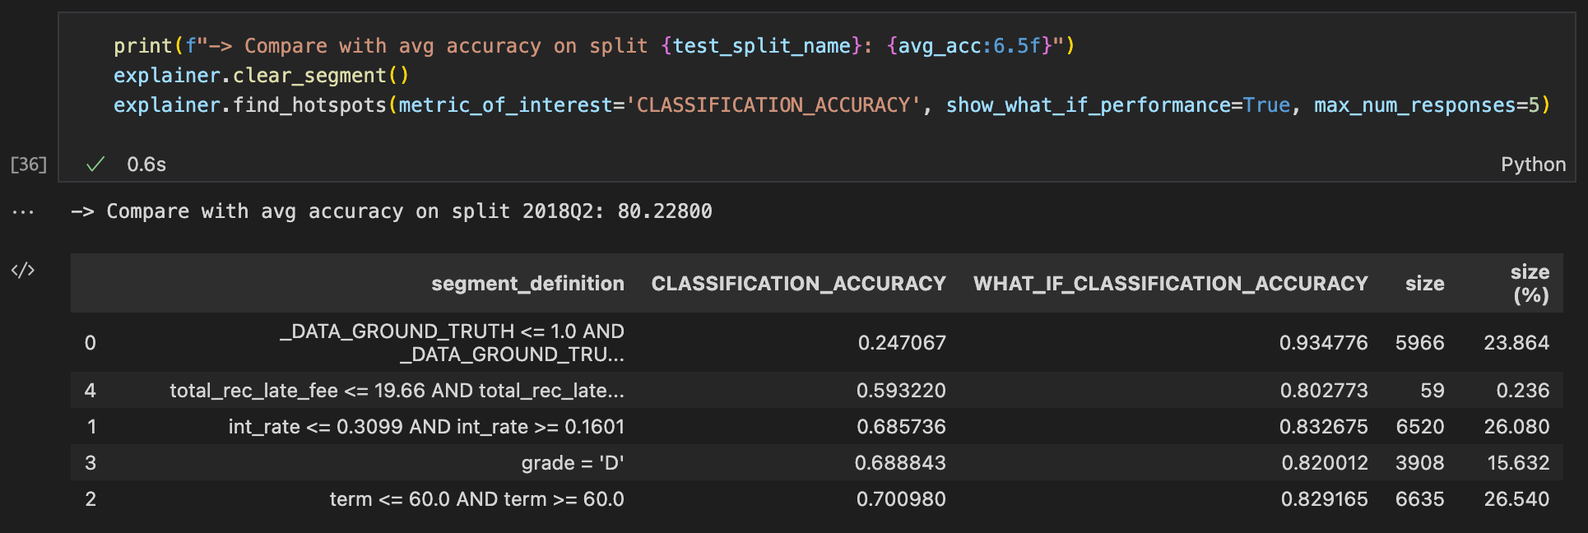
When requested using the show_what_if_performance parameter, the 'what if' metric is returned in addition to each segment-wise metric (pictured next).
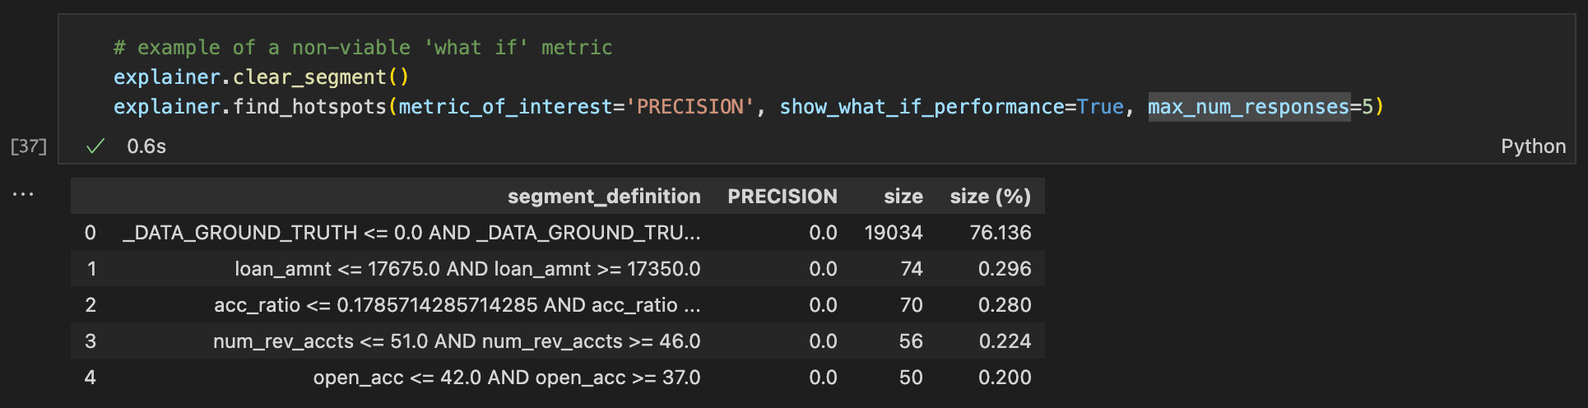
Keep in mind that the ‘what if’ metric can only be defined for a viable metric_of_interest expressed as the average of a linear combination of pointwise metrics (e.g., classification accuracy, mean squared error). This means that certain metrics of interest (e.g., AUC, precision) will not return a ‘what if’ metric even if requested, as shown in the next example.
Here's the current list of supported "what if" metrics:
Classification
- Classification Accuracy
- Log Loss
Regression
- Mean Absolute Error
- Mean Squared Error
- Mean Squared Log Error
See Performance Metrics for definitions.
Important Caveats Regarding Web App Support
With release of TruEra v1.33, the TruEra Web App support for find_hotspots() exposes these parameters only:
num_featuresminimum_sizemetric_of_interest
Also, because the Web App's find_hotspots() workflow does not currently use a comparison split, the experimental metric of interest UNDER_OR_OVERSAMPLING is not enabled.
Click Next below to continue.