JavaScript Object Notation
Lightweight format for storing and transporting data.Setting Up Alerts and Notifications
With Truera, you can create custom alerts for any metric in the dashboard.
Setting up real-time alert notifications with regard to a model's output in production — to assist in quickly spotting anomalous output/activity or to help isolate a trend at its origination point — is a three step process:
- Adding Alert Configurations to identify when anomalies happen.
- Adding the Contact Points to be automatically notified when alerts are triggered.
- Adding rules to filter the Alert Event History list of triggered events.
The following guidance will help you configure all three.
Add/Change an Alert
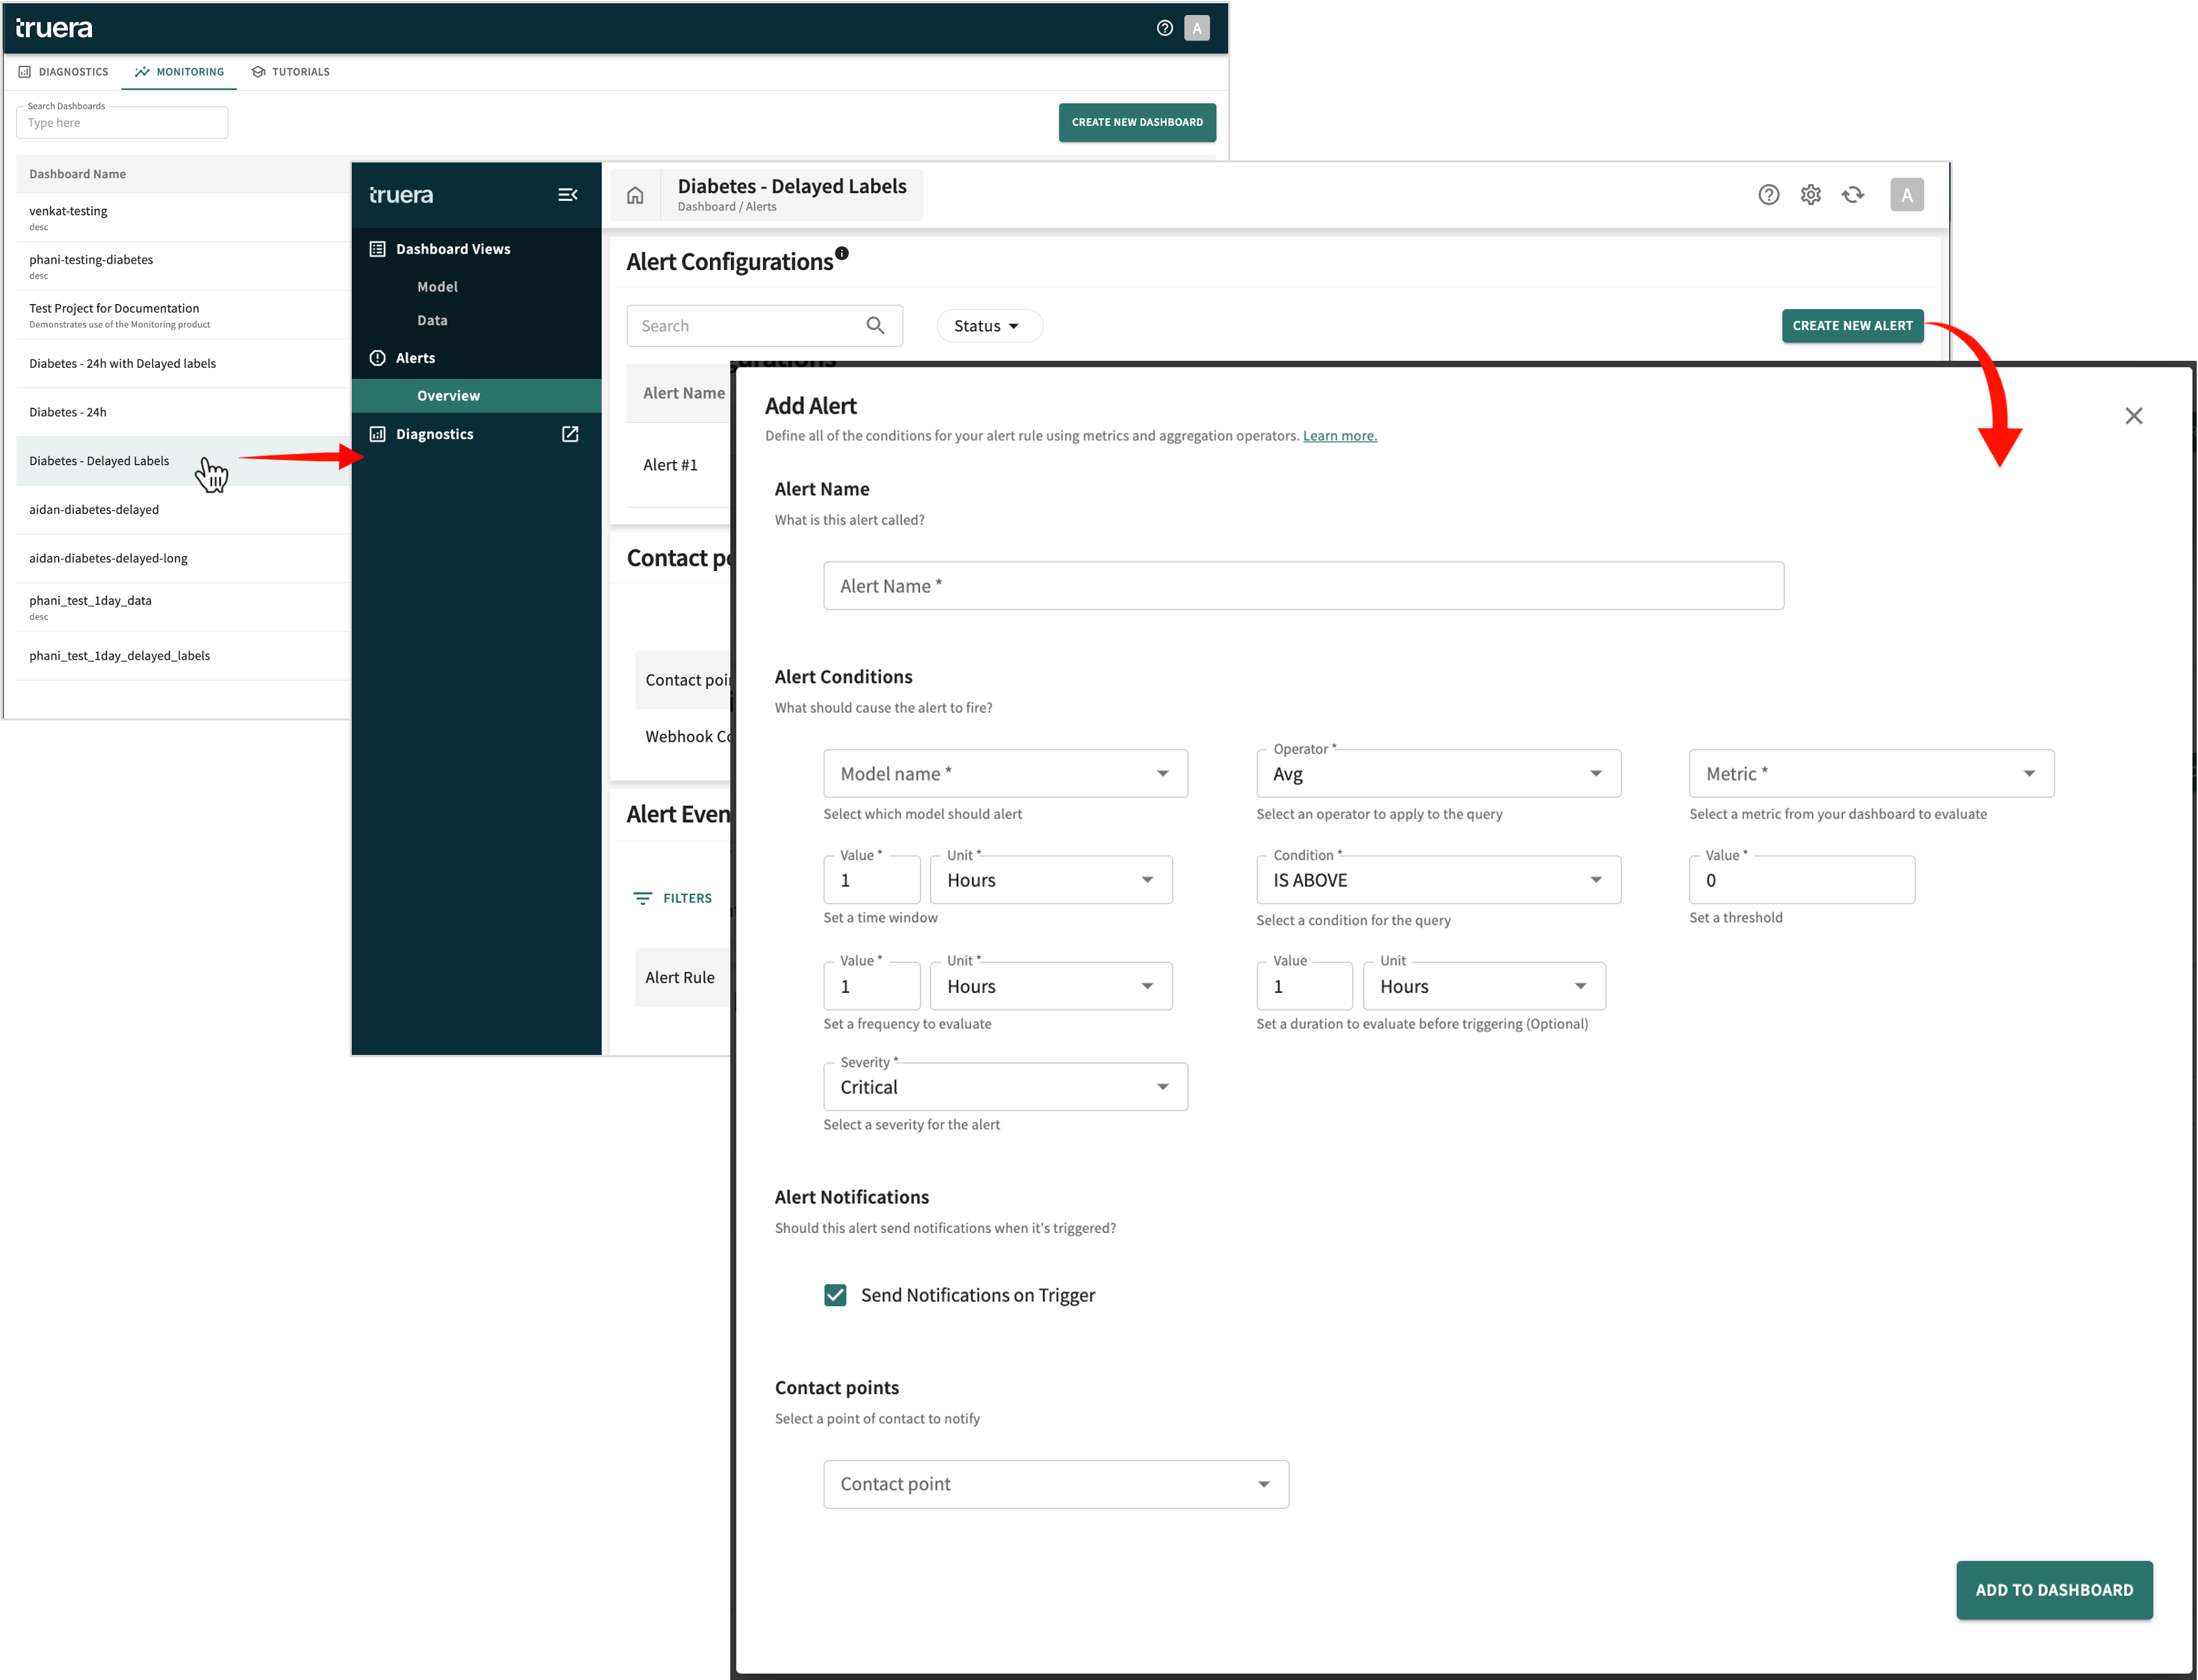
If not already open, select the desired dashboard under the Monitoring tab, click Overview under Alerts, then click CREATE NEW ALERT.
Tip
Clicking VIEW ALERT HISTORY in Dashboard Views will also open your Alert Configurations.
Next, configure the alert by providing the following information in the Add Alert overlay:
- Enter the Alert name (required).
- Select a Model name from the dropdown list of models monitored by this dashboard.
- Select a Metric from the dropdown list of metrics configured for this dashboard.
- Select aggregation Operator to apply your chosen metric, such as avg, min, sum, count, max, min, etc.
- Select the triggering Condition for the aggregated metric: ISABOVE, ISBELOW, IS OUTSIDE RANGE, IS WITHIN RANGE, or HAS NO VALUE.
- Enter values defining a Threshold (range) to check against the Condition specified in Step 5.
- Enter a monitoring Time Window value and select a standard unit of time to specify the target monitoring period (number of Minutes, Hours, or **Days).
- Enter a Frequency value and select a standard unit of time to specify how often within the Time Window (every x Minutes, Hours, or **Days) to test aggregated model output.
-
Enter an optional Duration value and select a standard unit of time to specify how long to continue testing aggregated model output after the condition is met before triggering this alert, such that:

Or, more conversationally:
If the specified Metric (aggregated using the specified Operator) is greater than the specified Threshold within the specified Time Window as measured every Frequency for the specified Duration, then fire this alert.
-
Enable Send Notifications on Trigger if you want to electronically notify the configured Contact Points as soon as the alert is triggered. Disable it if you don't want an immediate notification sent.
- Select a Contact Point (only contact points already configured are selectable).
- Click ADD TO DASHBOARD to save this alert and associate it with the dashboard.
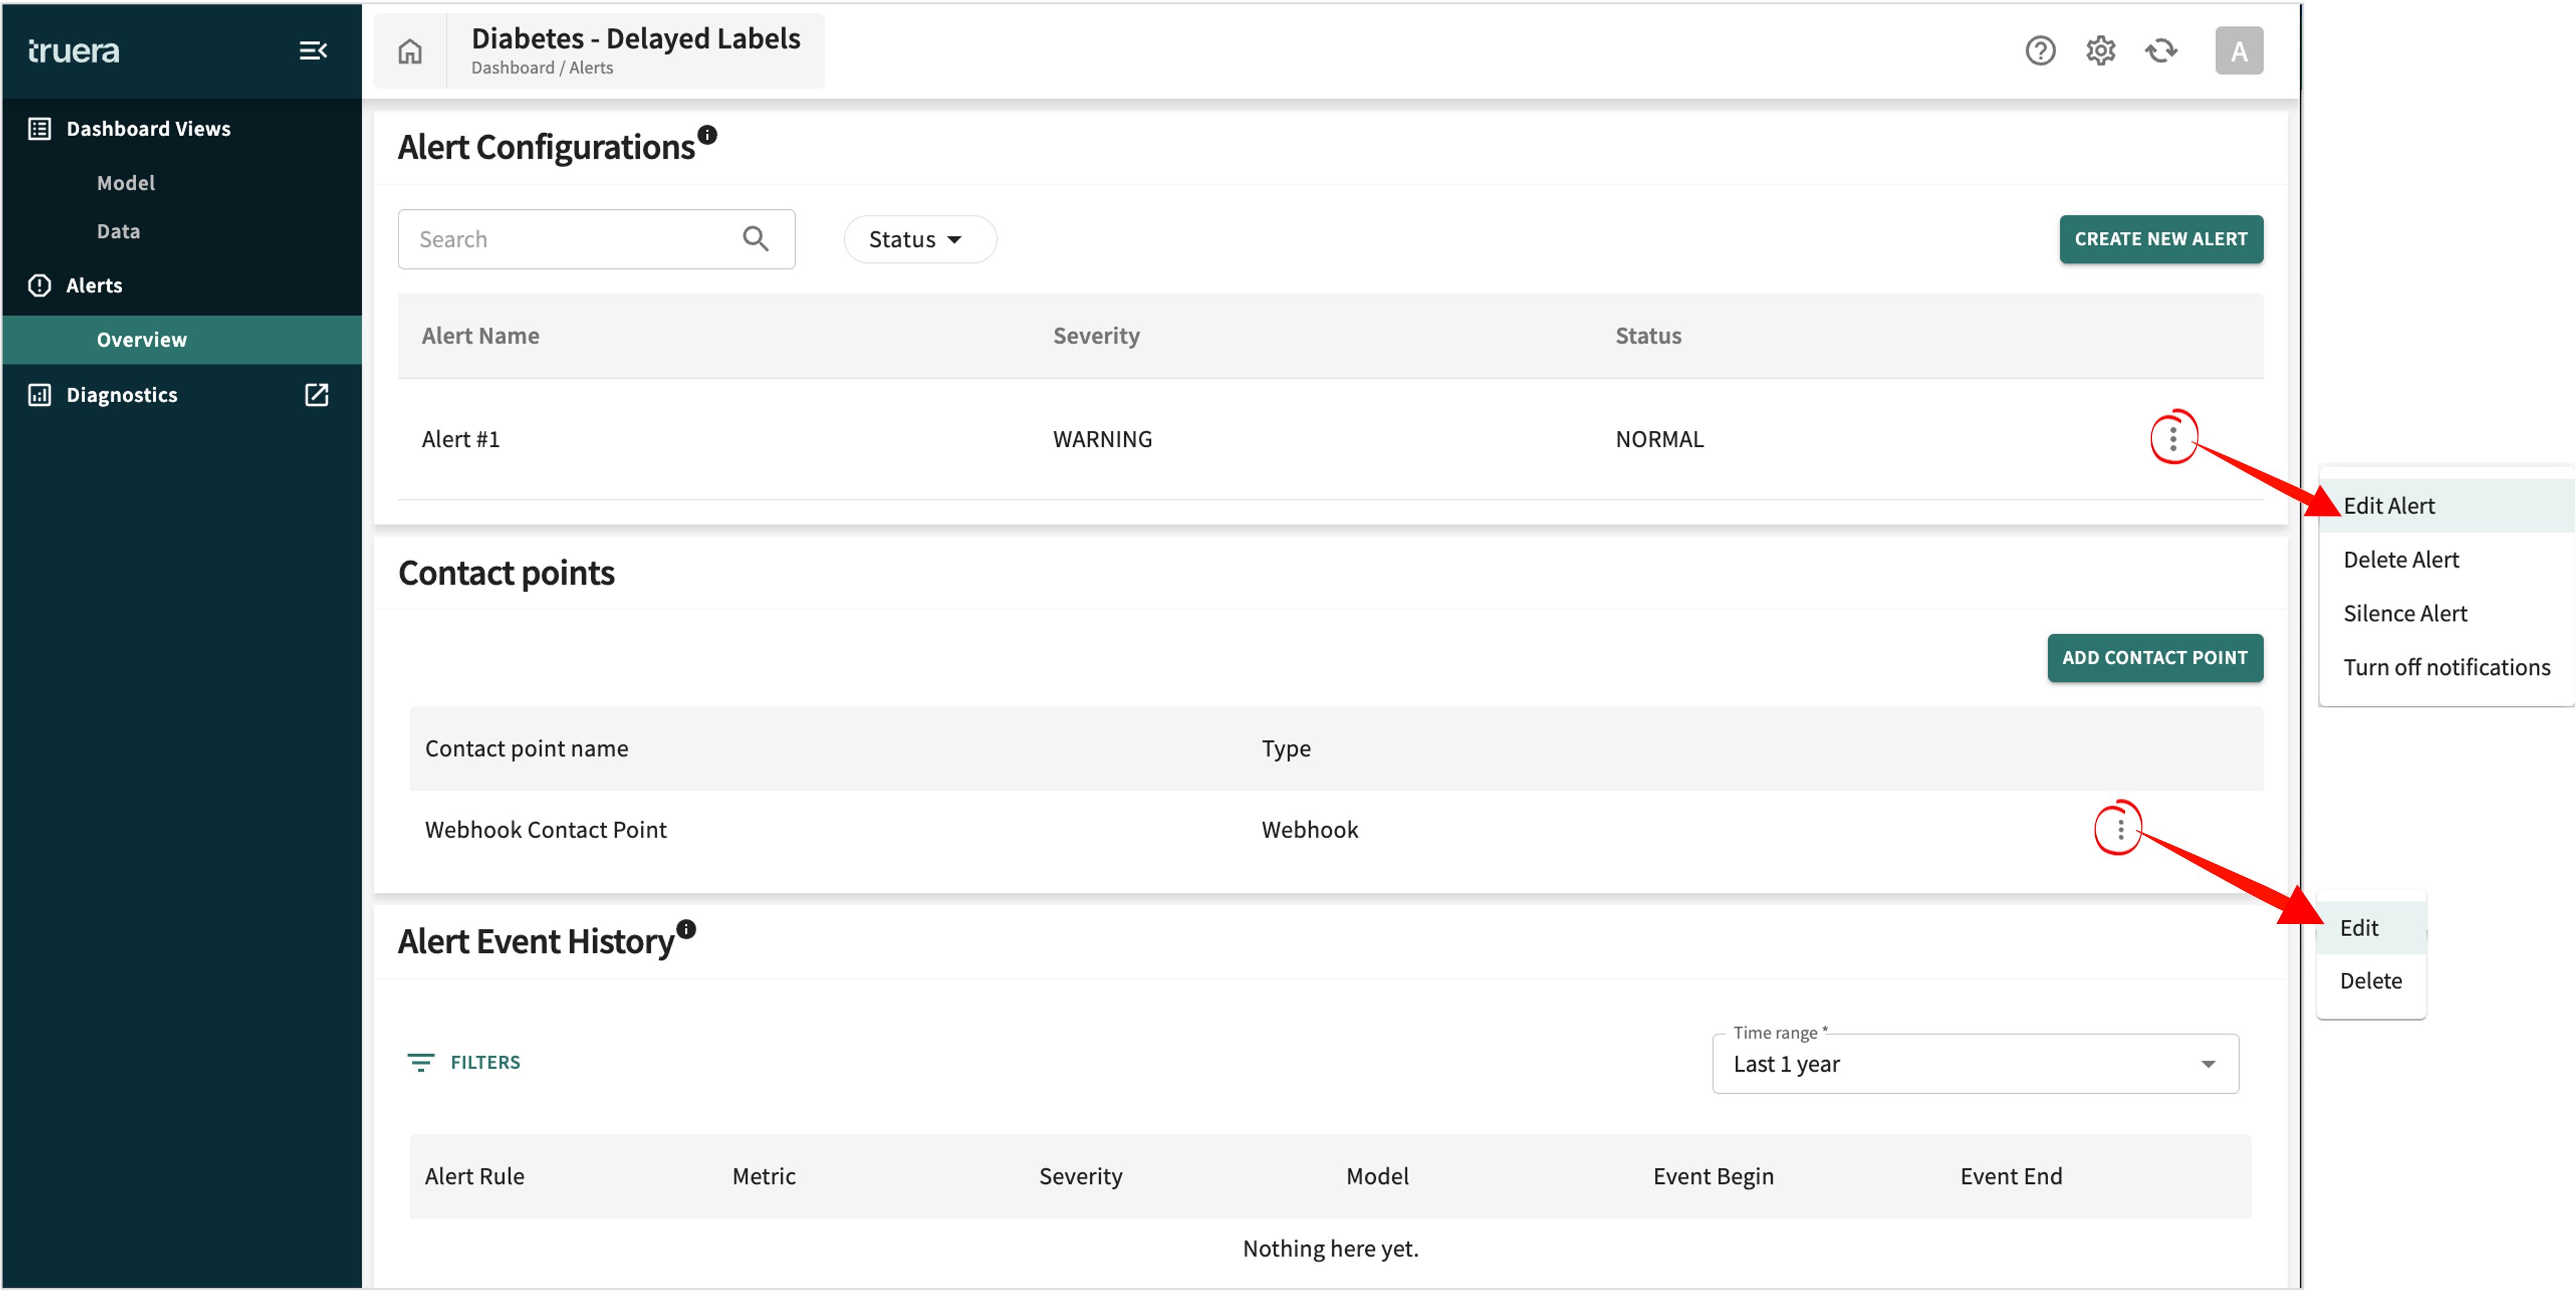
To change an existing alert, click the icon for the desired alert and select Edit Alert.
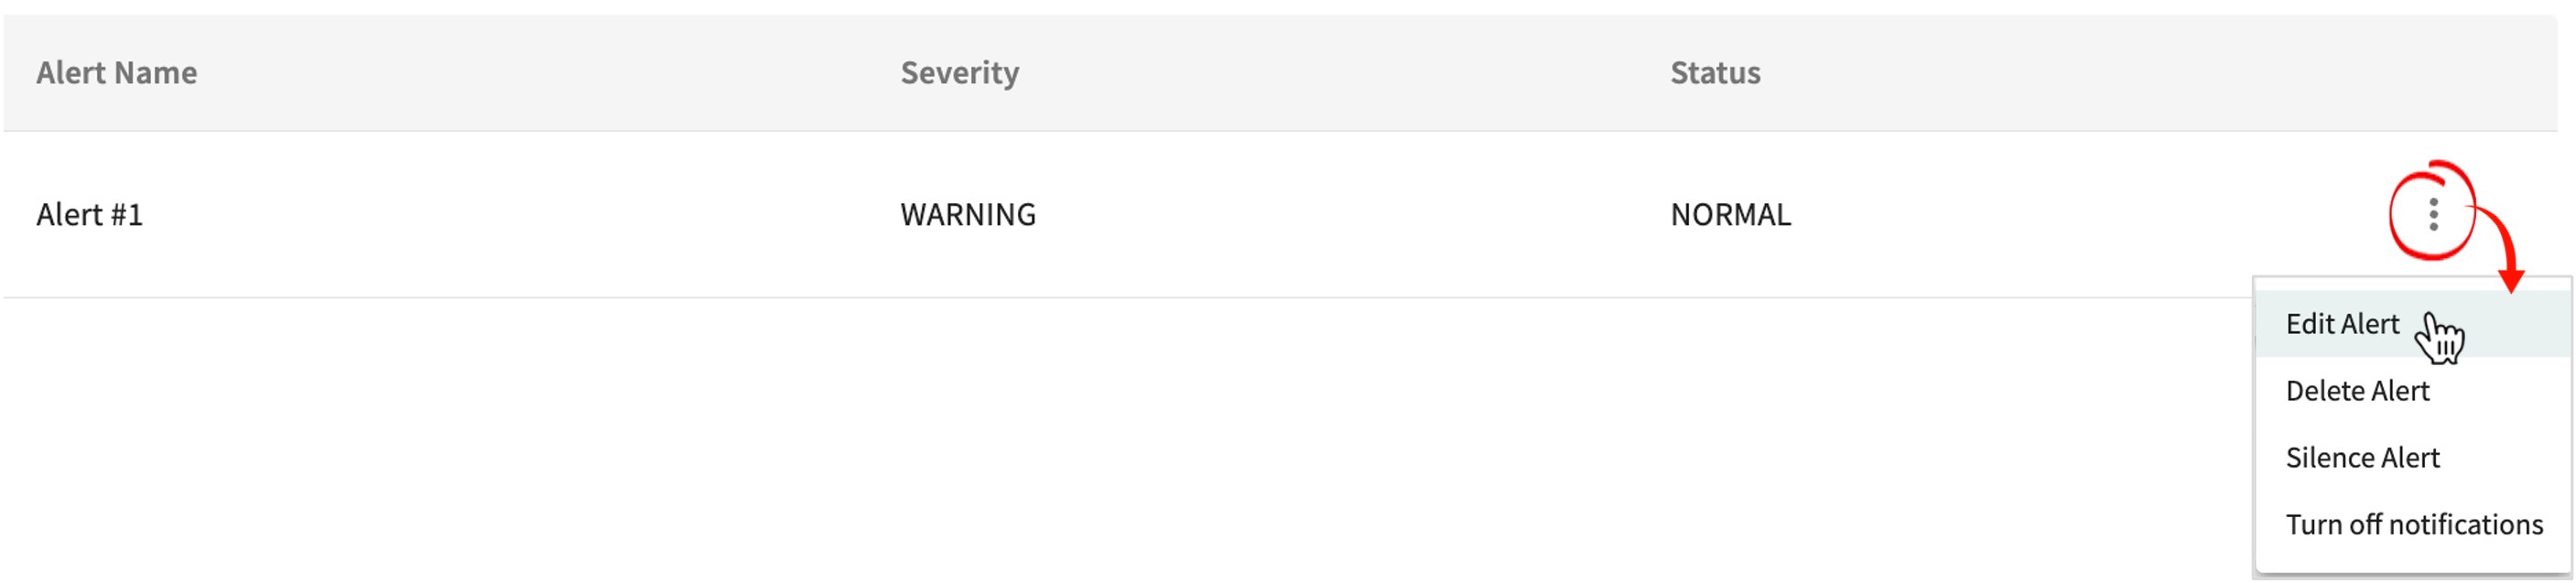
As pictured, additional options are available to Delete Alert (remove it altogether), Silence Alert (suspend it for a specified Duration), and Turn off/on notifications (stop delivery to configured contact points).
Add/Change Contact Points
Contact points represent the digital endpoints — either Email or Webhook — that receive notifications when alerts are triggered. If the contact point is Email, a message containing the alert particulars is automatically sent to the inbox of the configured recipient(s). If the contact point is Webhook, a callback (HTTP POST or PUT) message in
JSON
format is pushed to the configured endpoint.Webhooks obviate the need to poll the TruEra platform for status changes detected during production monitoring. Sometimes referred to as
reverse APIs
or push APIs, TruEra sends you a single Reverse APIs
Also called webhooks, web callbacks, or HTTP push APIs – a way to provide other applications with real-time information by delivering data as an event happens or almost immediately.HTTP POST or PUT request
as soon as pertinent data is available.Data sent to an endpoint to create or update a resource; requests that the listening server accept the data enclosed in the message pursuant to taking some appropriate action or no action at all. The difference between POST and PUT is that PUT requests are idempotent, which means calling the same PUT request multiple times will always produce the same result.
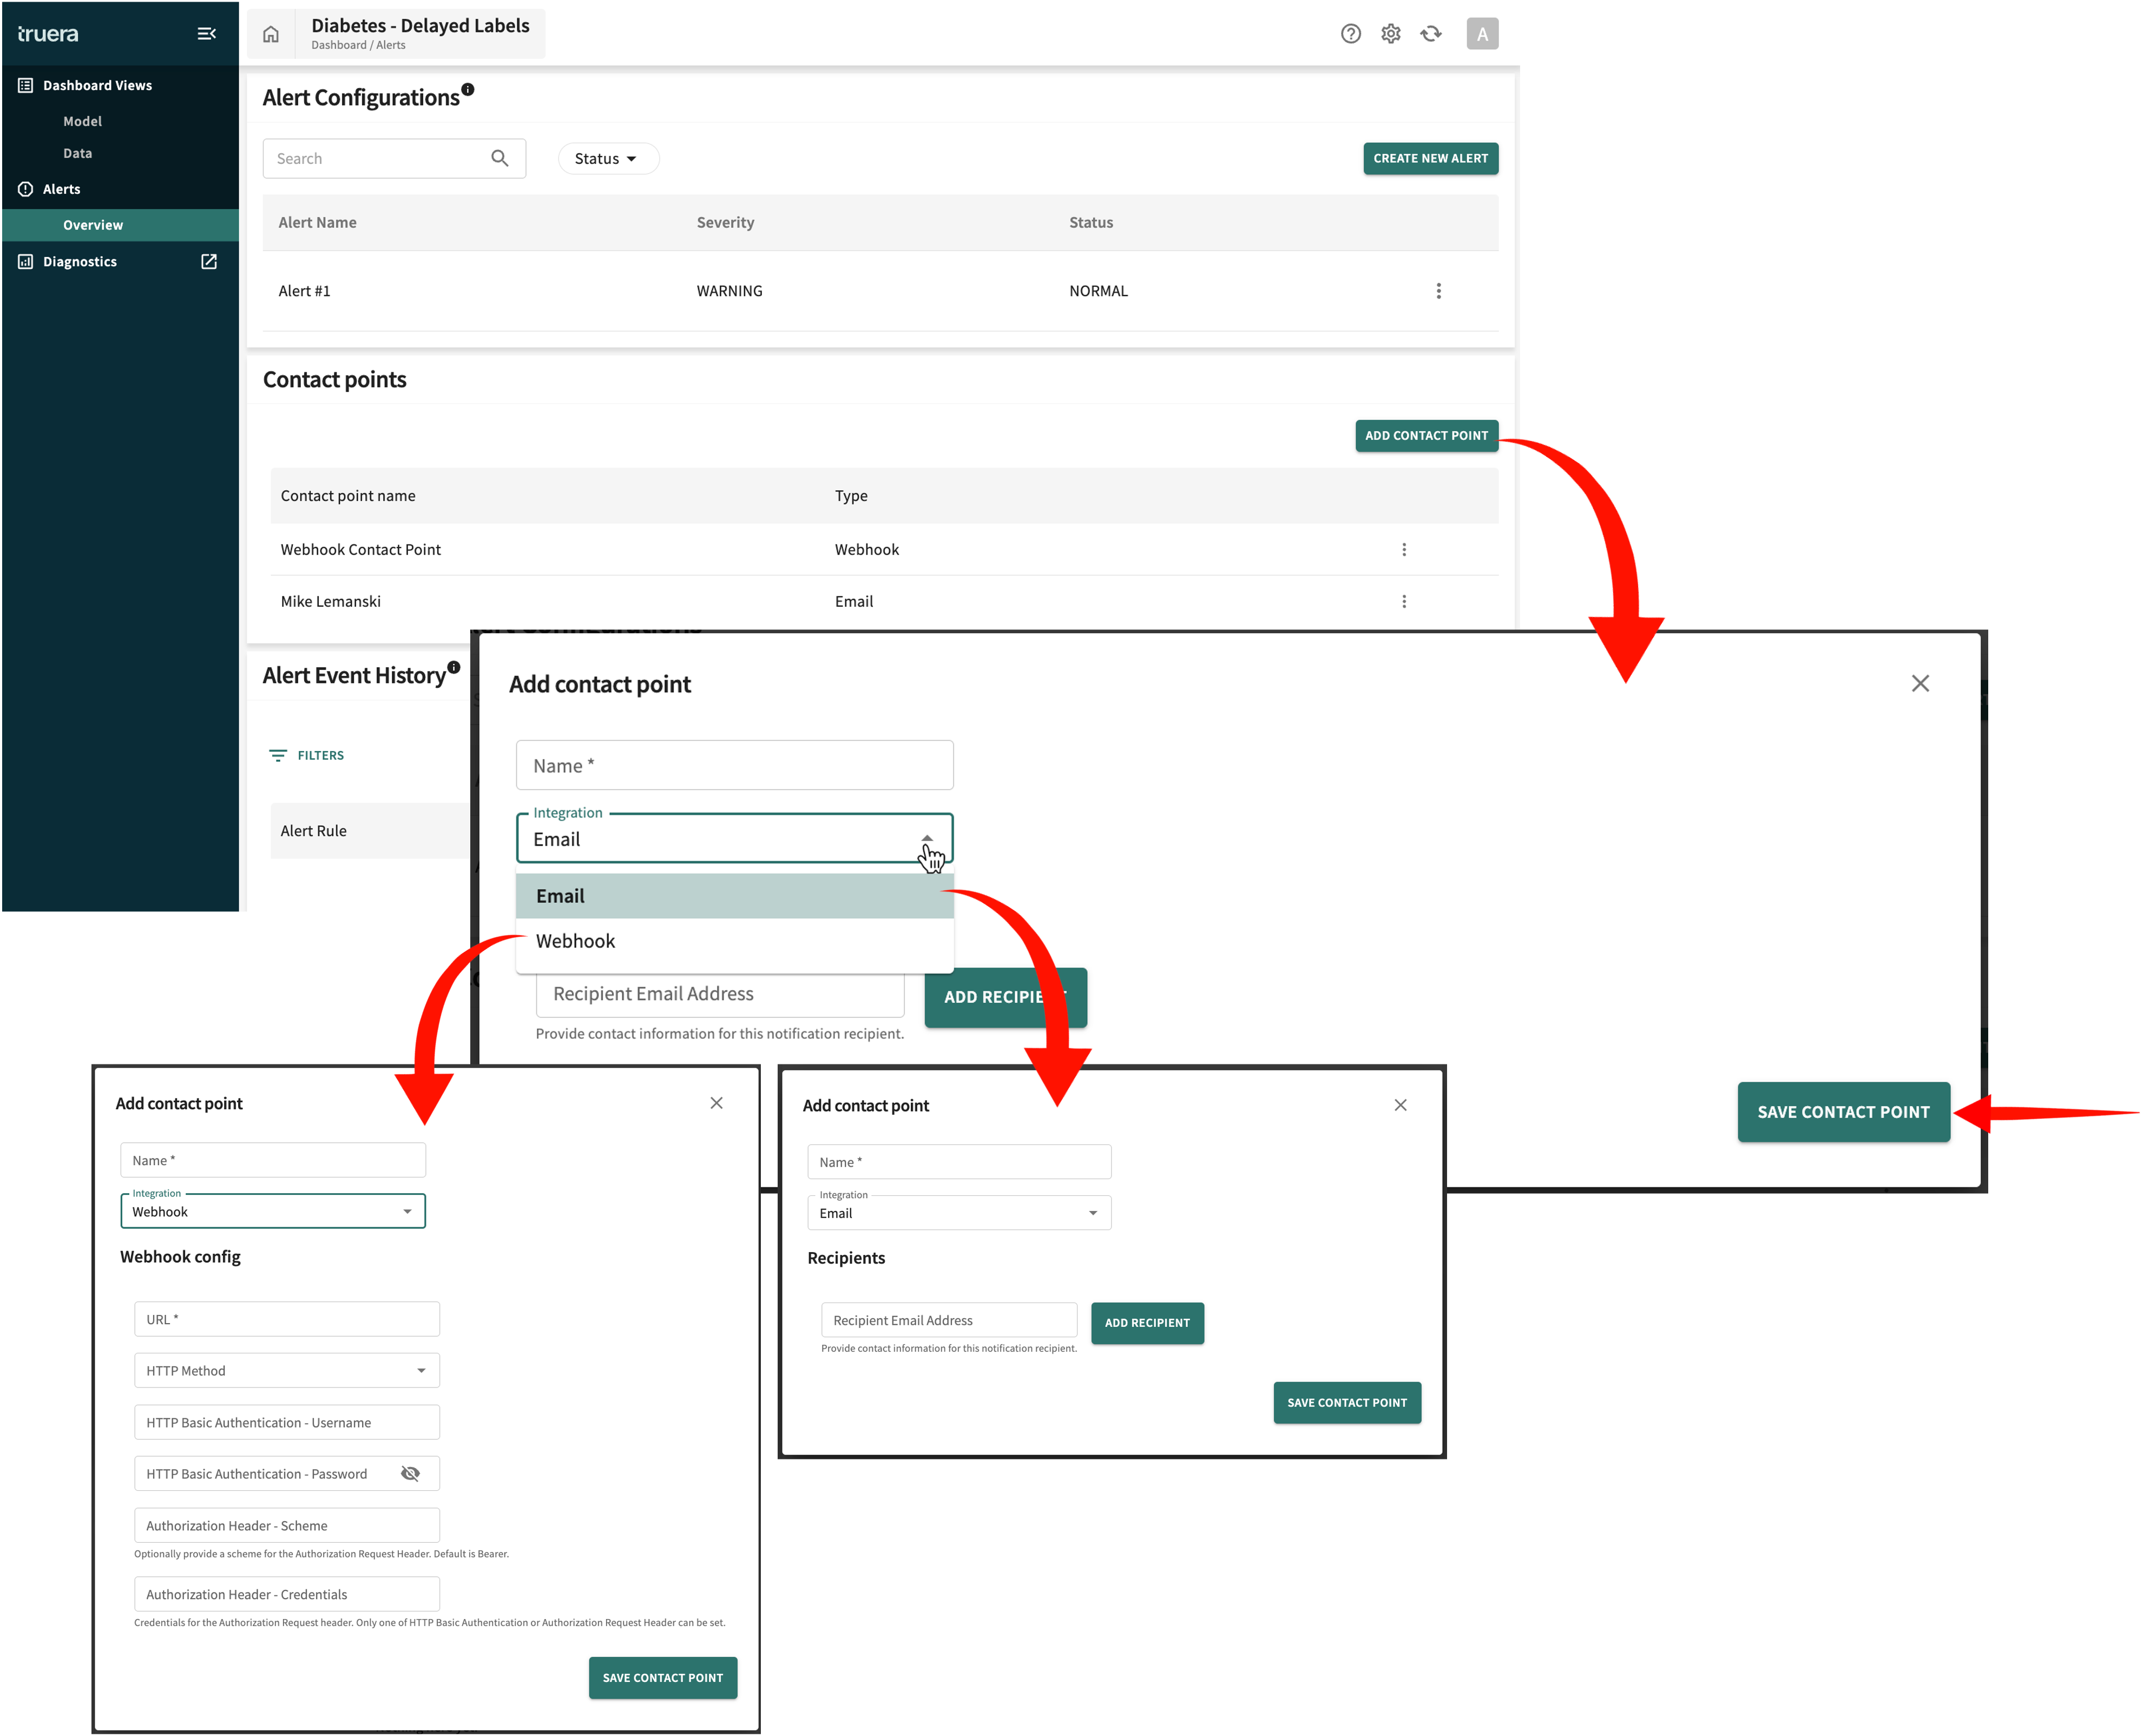
To create a new contact point, click ADD CONTACT POINT in the Contact points panel, then provide the following information:
- Enter a Name (required).
- Select the type of Integration, either Email or Webhook, then ...
- For Email, enter the Recipient Email Address and click ADD RECIPIENT.
- For Webhook:
- Enter the URL (endpoint) for the receiving server (required)
- Select the HTTP Method — either POST or PUT
- Enter the HTTP Basic Authentication - Username
- Enter the HTTP Basic Authentication - Password (click / to unmask or mask the password string)
- Enter an Authorization Header - Scheme or provide a scheme for the Authorization Request Header (
default = Bearer) - Enter the Authorization Header - Credentials
- Click SAVE CONTACT POINT to record the new/changed information.
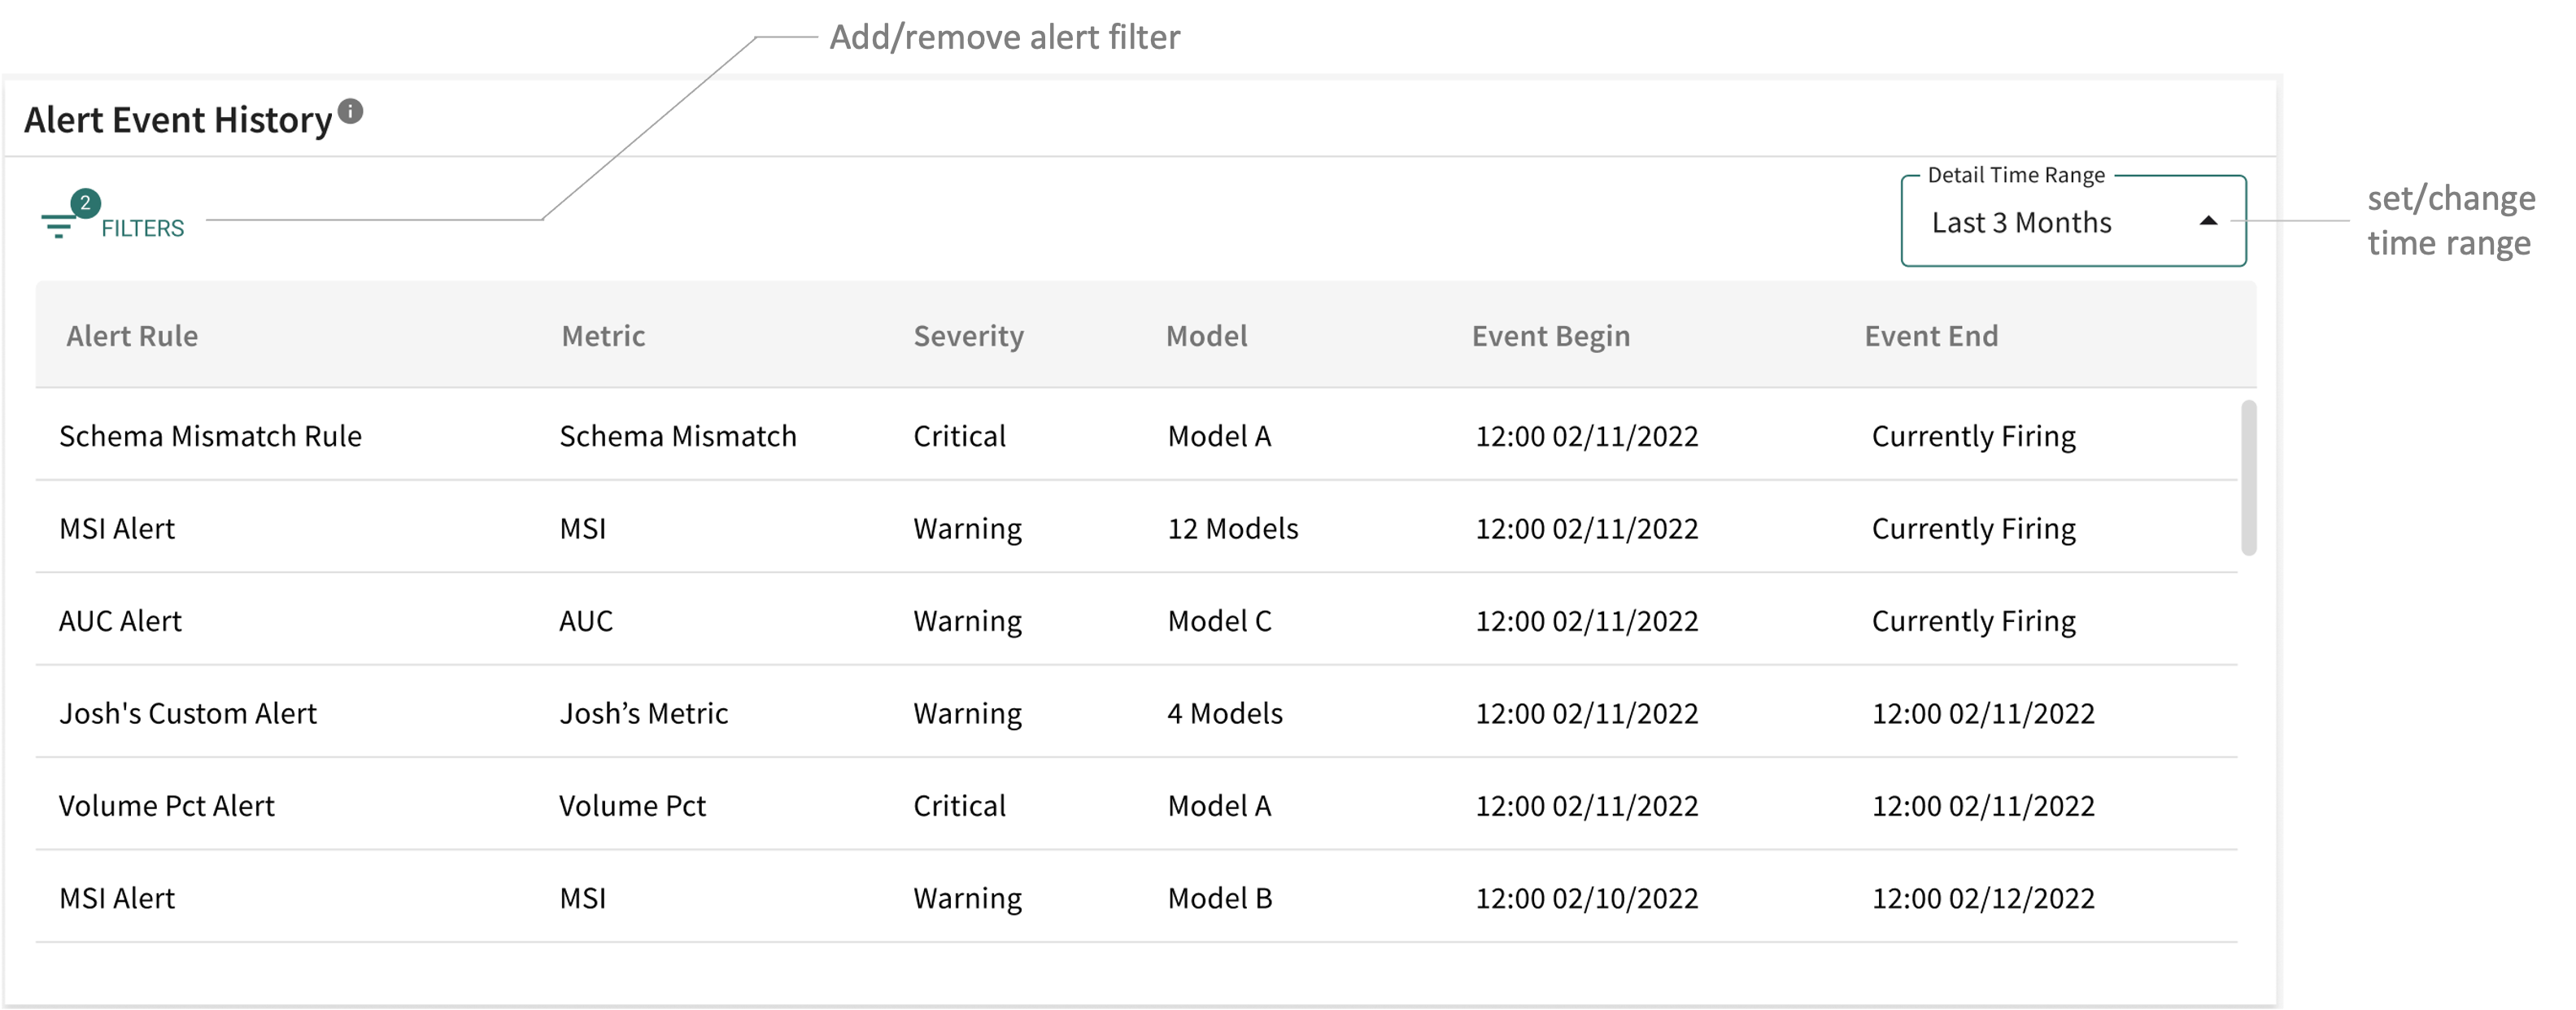
Alert Event History
This panel tracks all alert events recorded for a specified time period and filter based on the Alert Rules configured.
Creating/Changing an Event Filter
Filters let you narrow the list to those events matching a specified criteria.
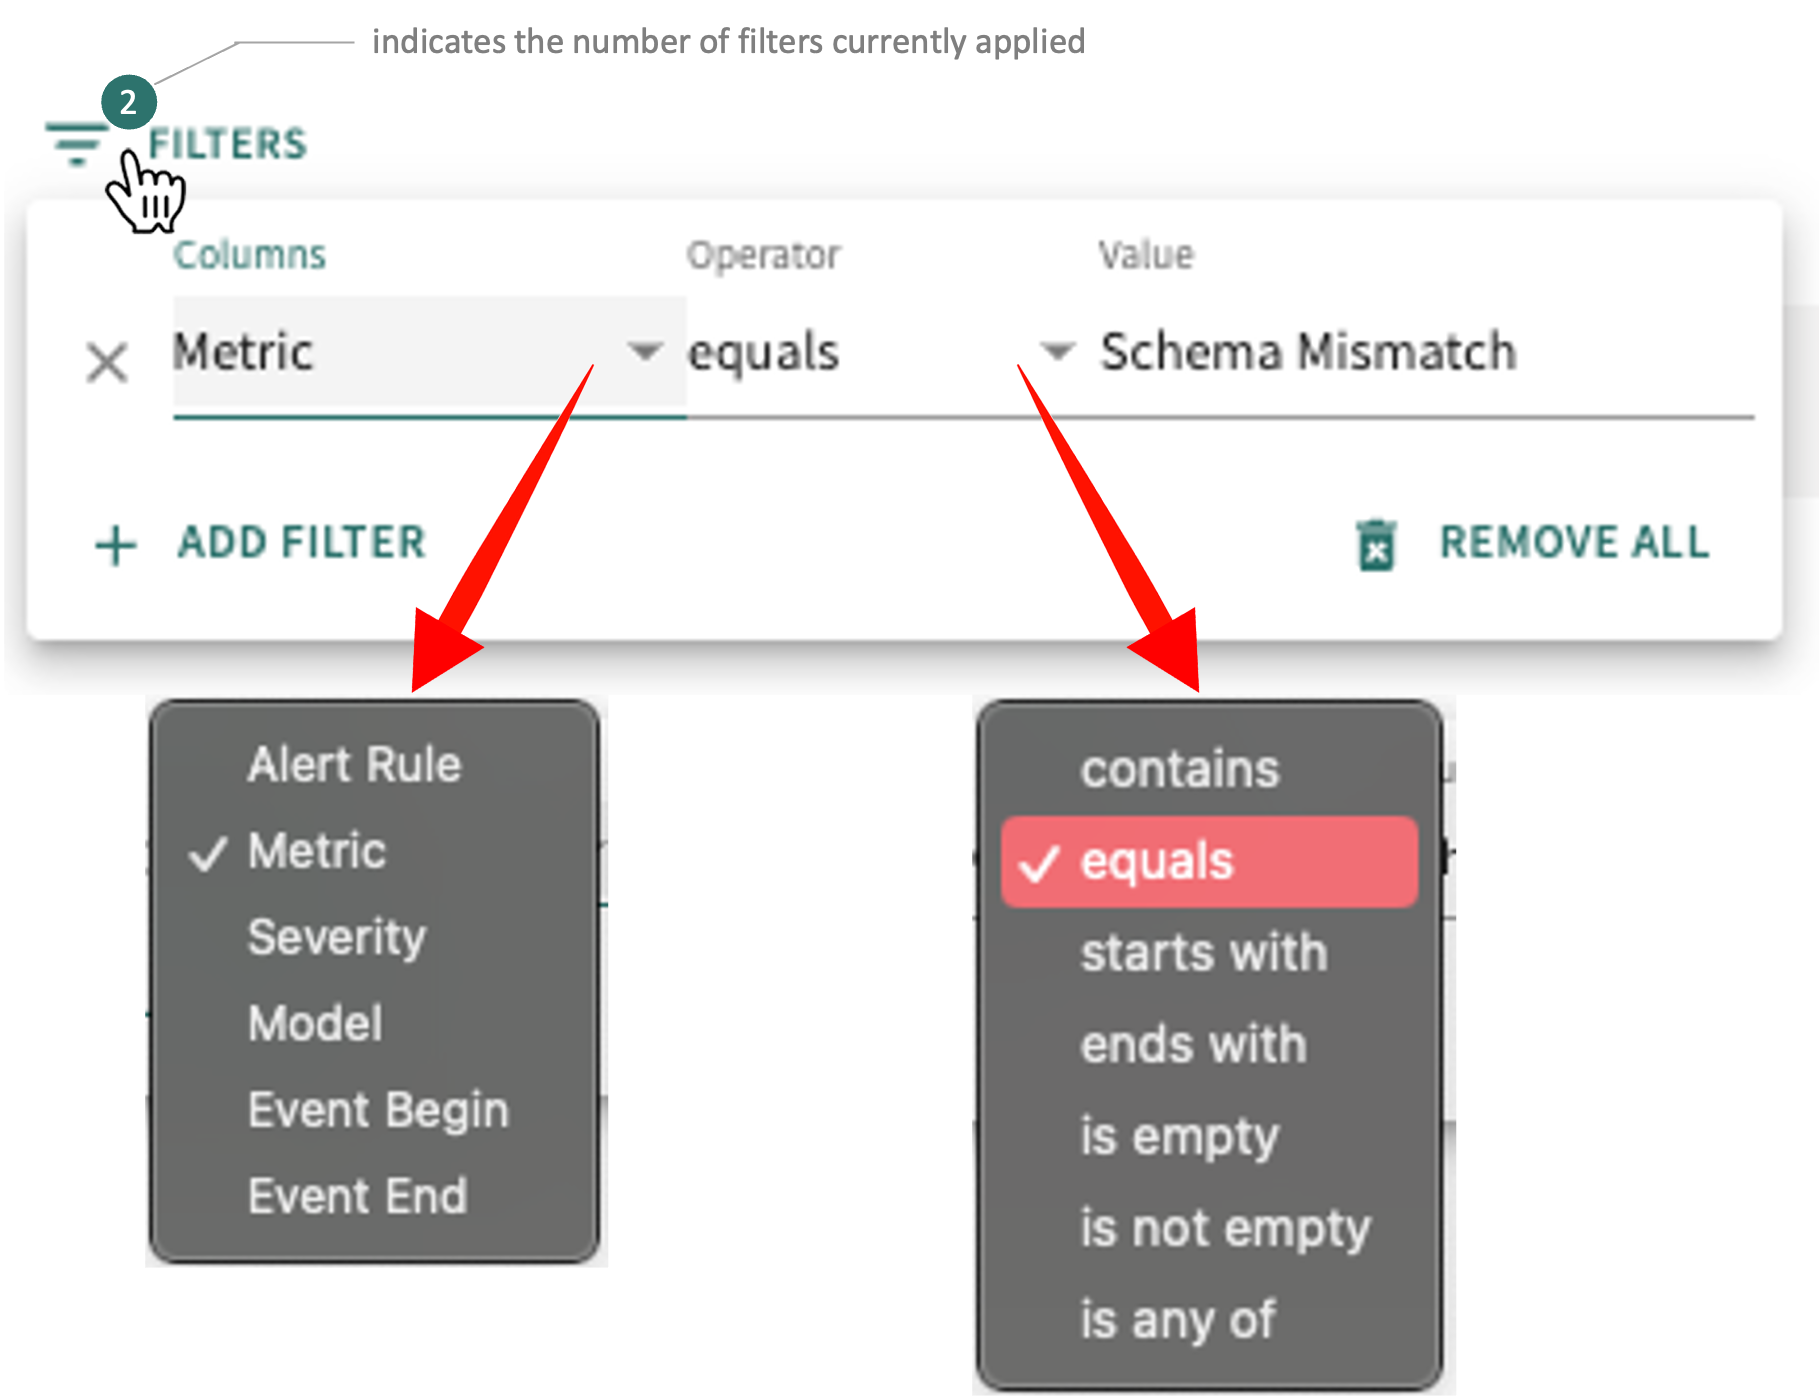
To create/change a filter:
- Click FILTERS.
- Select a column (Alert Rule, Metric, Severity, Model, Event Begin, or Event End).
- Select the Operator to compare column values against the specified Value (contains, equals, starts with, ends with, is empty, is not empty, is any of, etc.)
- Enter/select a respective value, as appropriate.
- Click ADD FILTER to save the information.
A Boolean operator (And, Or) is automatically displayed beneath the added filter to further refine/expand the criteria.
Click the corresponding ✕ to remove a filter. Click REMOVE ALL to delete all filter definitions.
Click the Time range drop-down to change the earliest occurrence desired (Last 1 week, Last 1 month, Last 3 months, or Last 1 year).
Click Next below to continue.