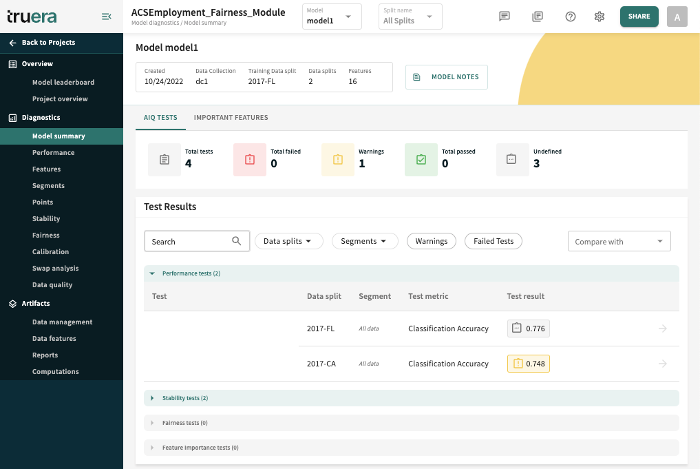
TruEra's Model Summary provides a snapshot of the selected model, including when it was created, its data collection, training data split (when specified and available), the number of splits in the model's data collection, and the total number of features.
click and hold to enlarge
Here, you can see the diagnostic evaluations for a selected model across data splits for Performance, Stability, and Fairness, then quickly zero-in on the most influential features. You can also add you own MODEL NOTES to notes made by other collaborators.
Note
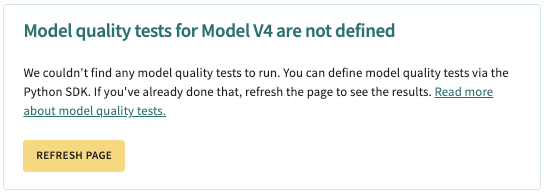
Model quality tests are defined using TruEra's Python SDK. If no tests have been defined for the selected model, a notification similar to the following is displayed:
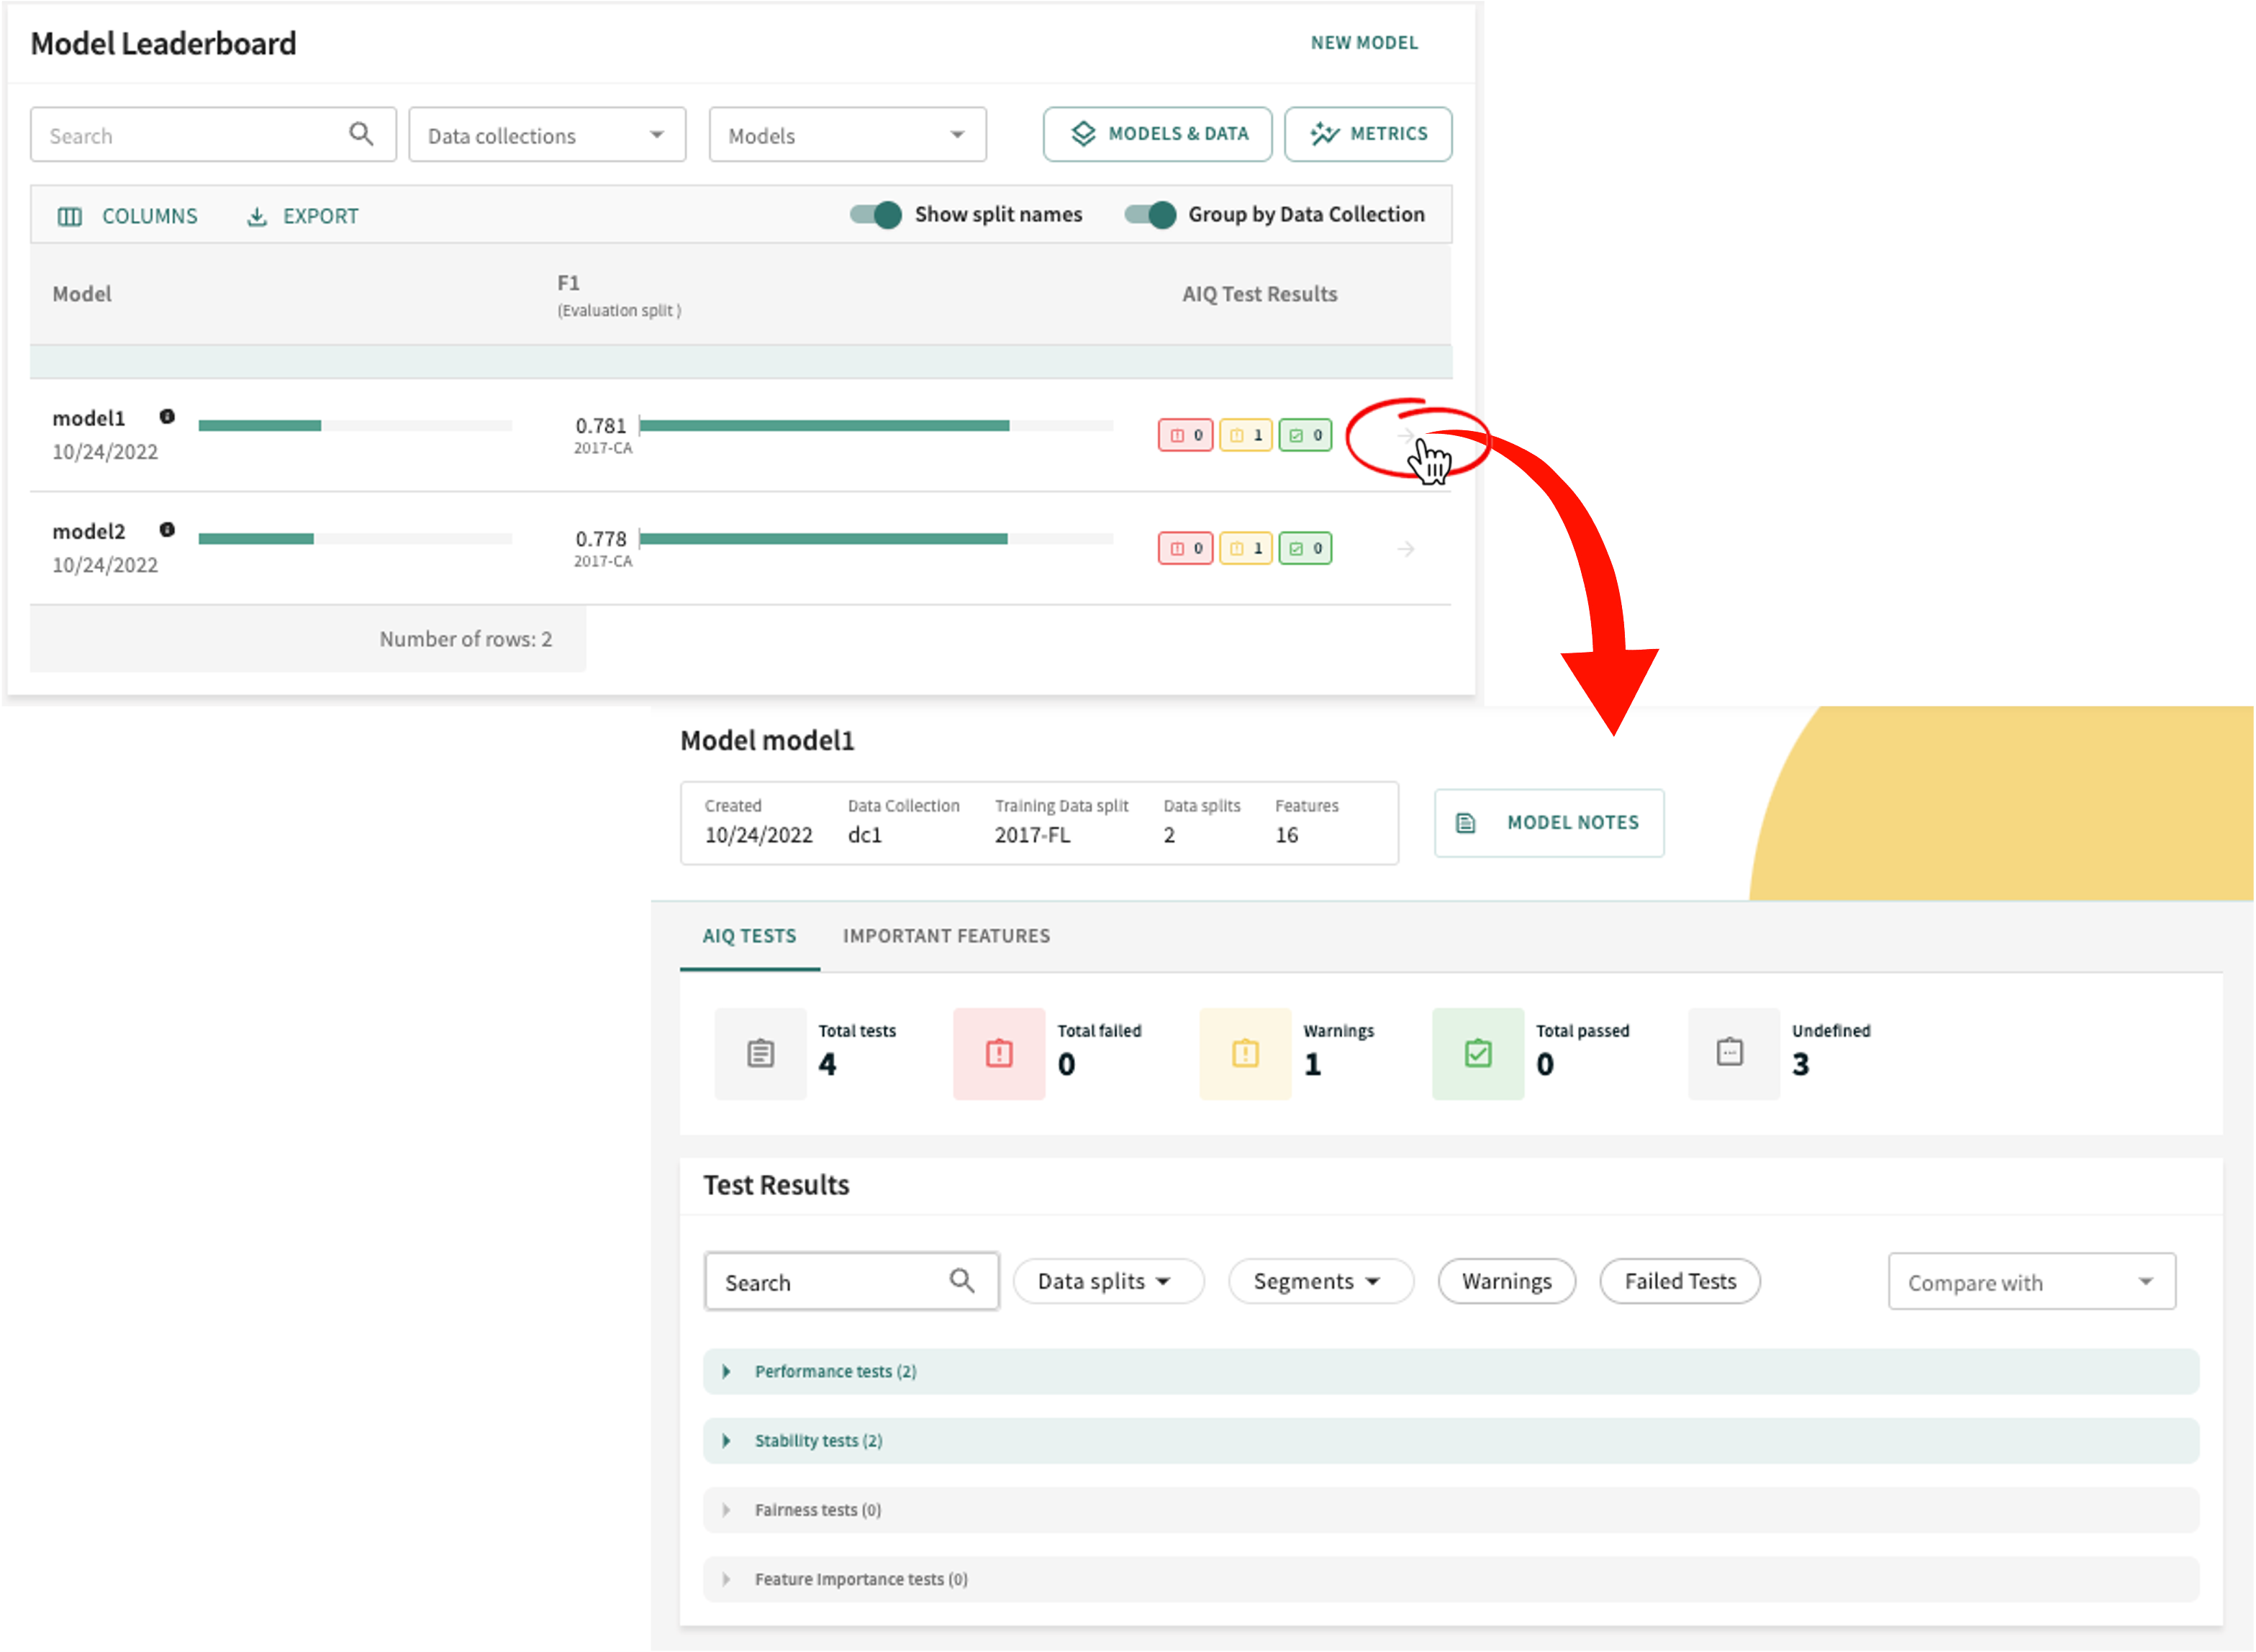
If you haven't done so already, open your test summaries by clicking Model Test Summaries in the Web App navigator (left side of the window). You can also open the summaries from the Model Leaderboard by clicking arrow in the right-most column for the corresponding model (pictured below).
The quality tests defined for the selected model are listed under the AIQ TESTS tab, which summarizes the model's current test results (pictured next) and (pictured above) lists the model's currently defined tests by Test type (Performance, Stability and Fairness), the Data split, Segment, and Test metric used for the test, and the model's resulting color-coded test Score — green for passed, yellow for passed but with warnings, and red for failed. Gray indicates an undefined test result.
click and hold to enlarge
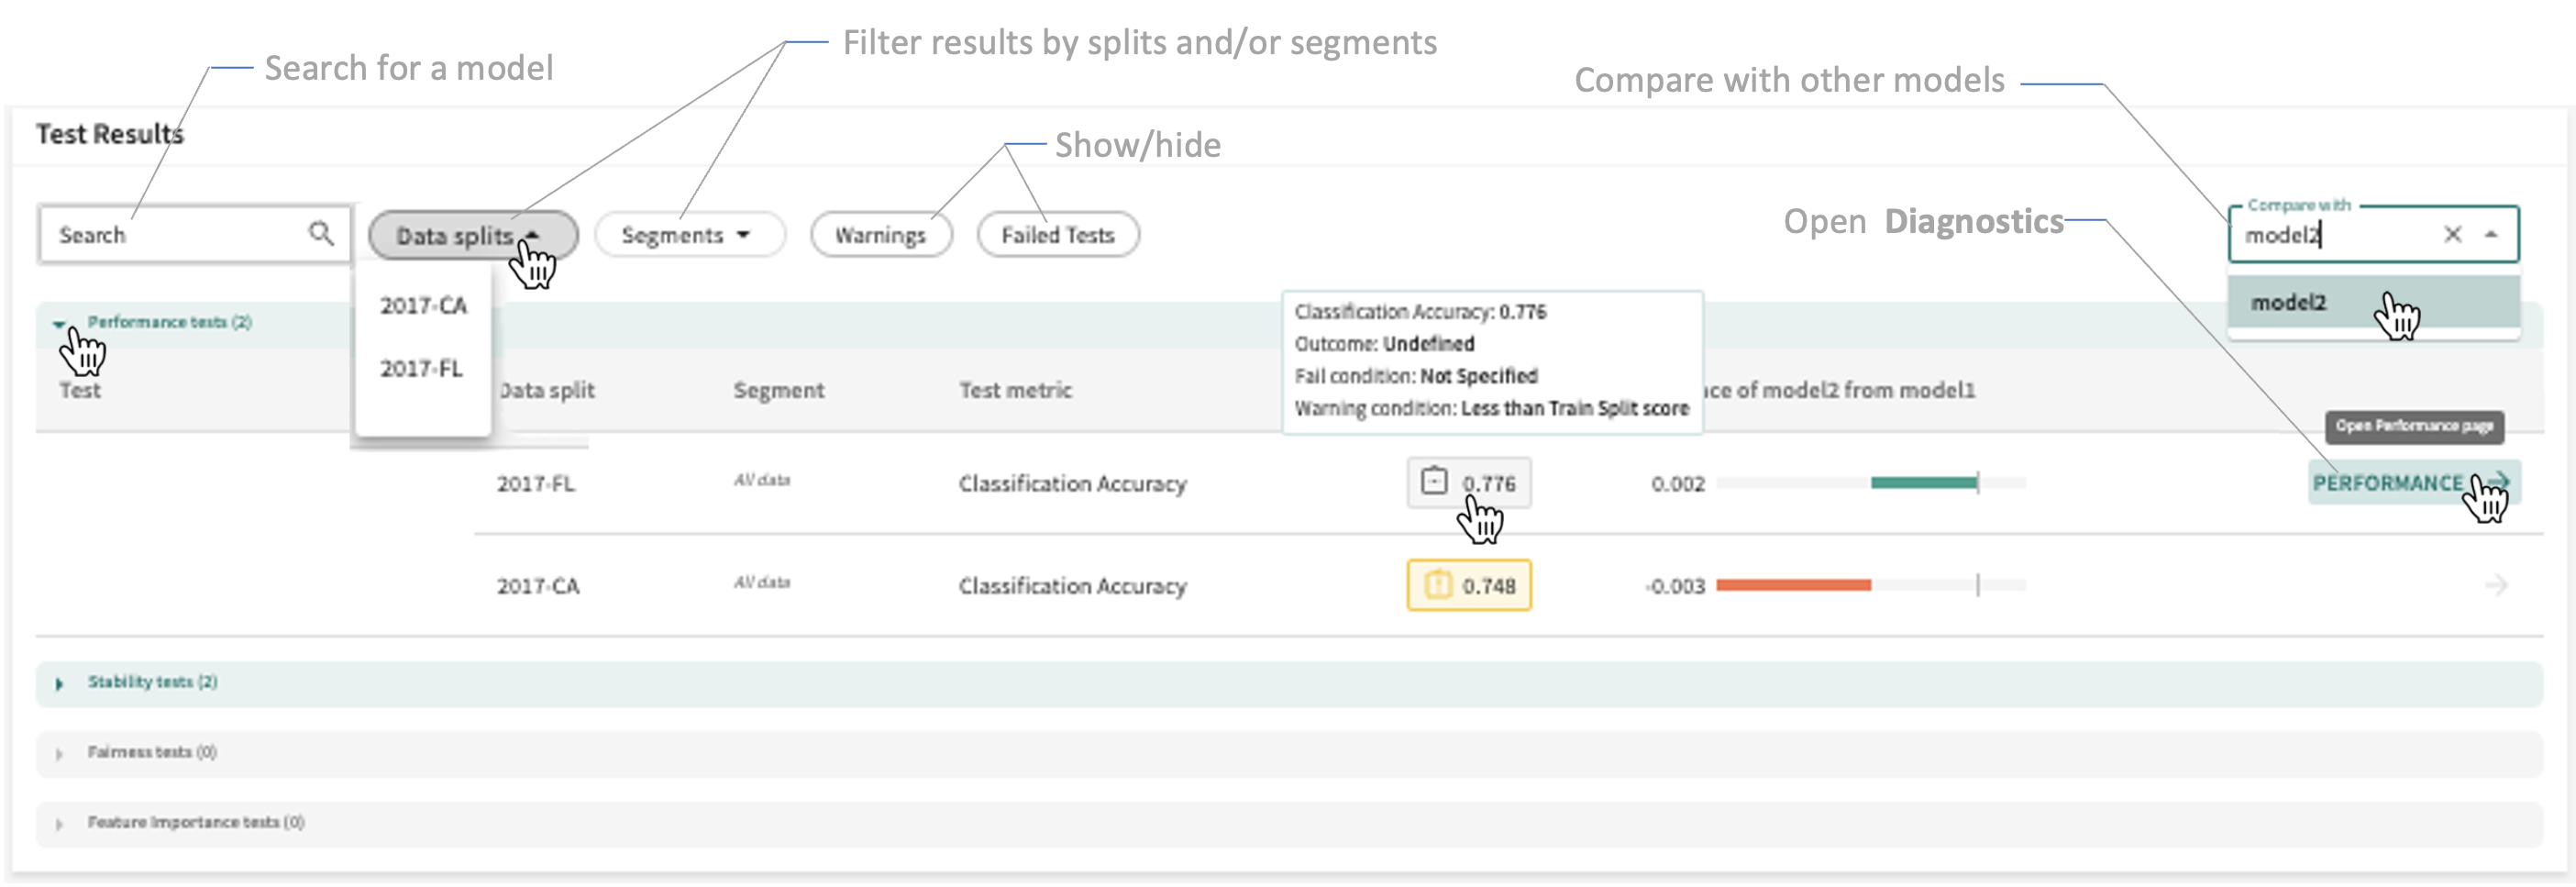
To view the model's diagnostic evaluation across data splits, click the arrow in the far left of title bar for the desired test to link to the diagnostic area specified by the Test type (Undefined, Performance, Fairness, Stability, or Feature Importance).
When the list is extensive, you can either search for a particular test by its name or filter the list by Test type, Data splits, Segments and/or status (Passed, passed with one or more Warnings, or Failed Tests).
click and hold to enlarge
You can also compare models by clicking in the Compare with list box and selecting the desired model(s) you'd like to compare.
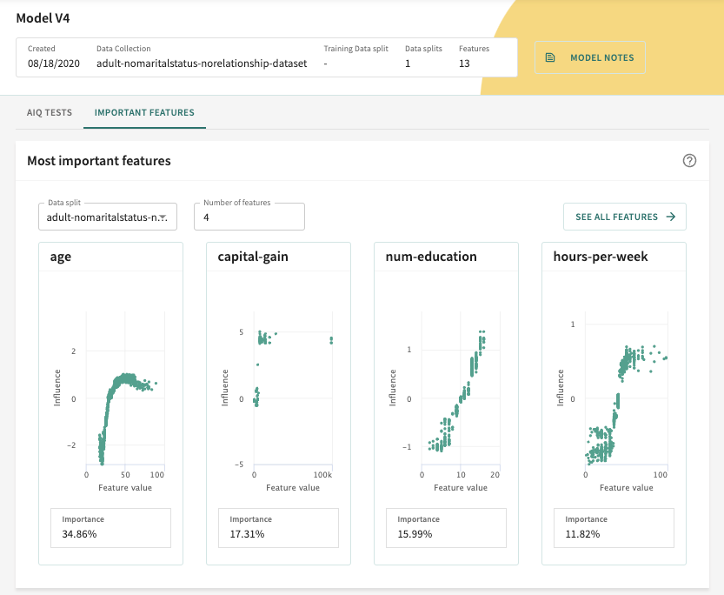
Visualizations of the most important features for the selected model and data split in terms of influence are found under the IMPORTANT FEATURES tab.
click and hold to enlarge
The features shown have the highest average influence measured as
L1
Regularization Methods
L1, also called a lasso regression, adds the “absolute value of magnitude” of the coefficient as a penalty term to the loss function.
L2, aka a ridge regression, adds the “squared magnitude” of the coefficient as the penalty term to the loss function.
norm (absolute value). These features most often contribute, either positively or negatively, toward the final model outcome, thus making them important.
Here, you can select the Data split and the Number of features by importance you want plotted.