Area Under the Curve
also known as C-statistics, ranges from 0 to 1; measures the two-dimensional area underneath the ROC curve.Need Access to TruEra Monitoring?
Click here for important information about whitelisted access to TruEra Monitoring.
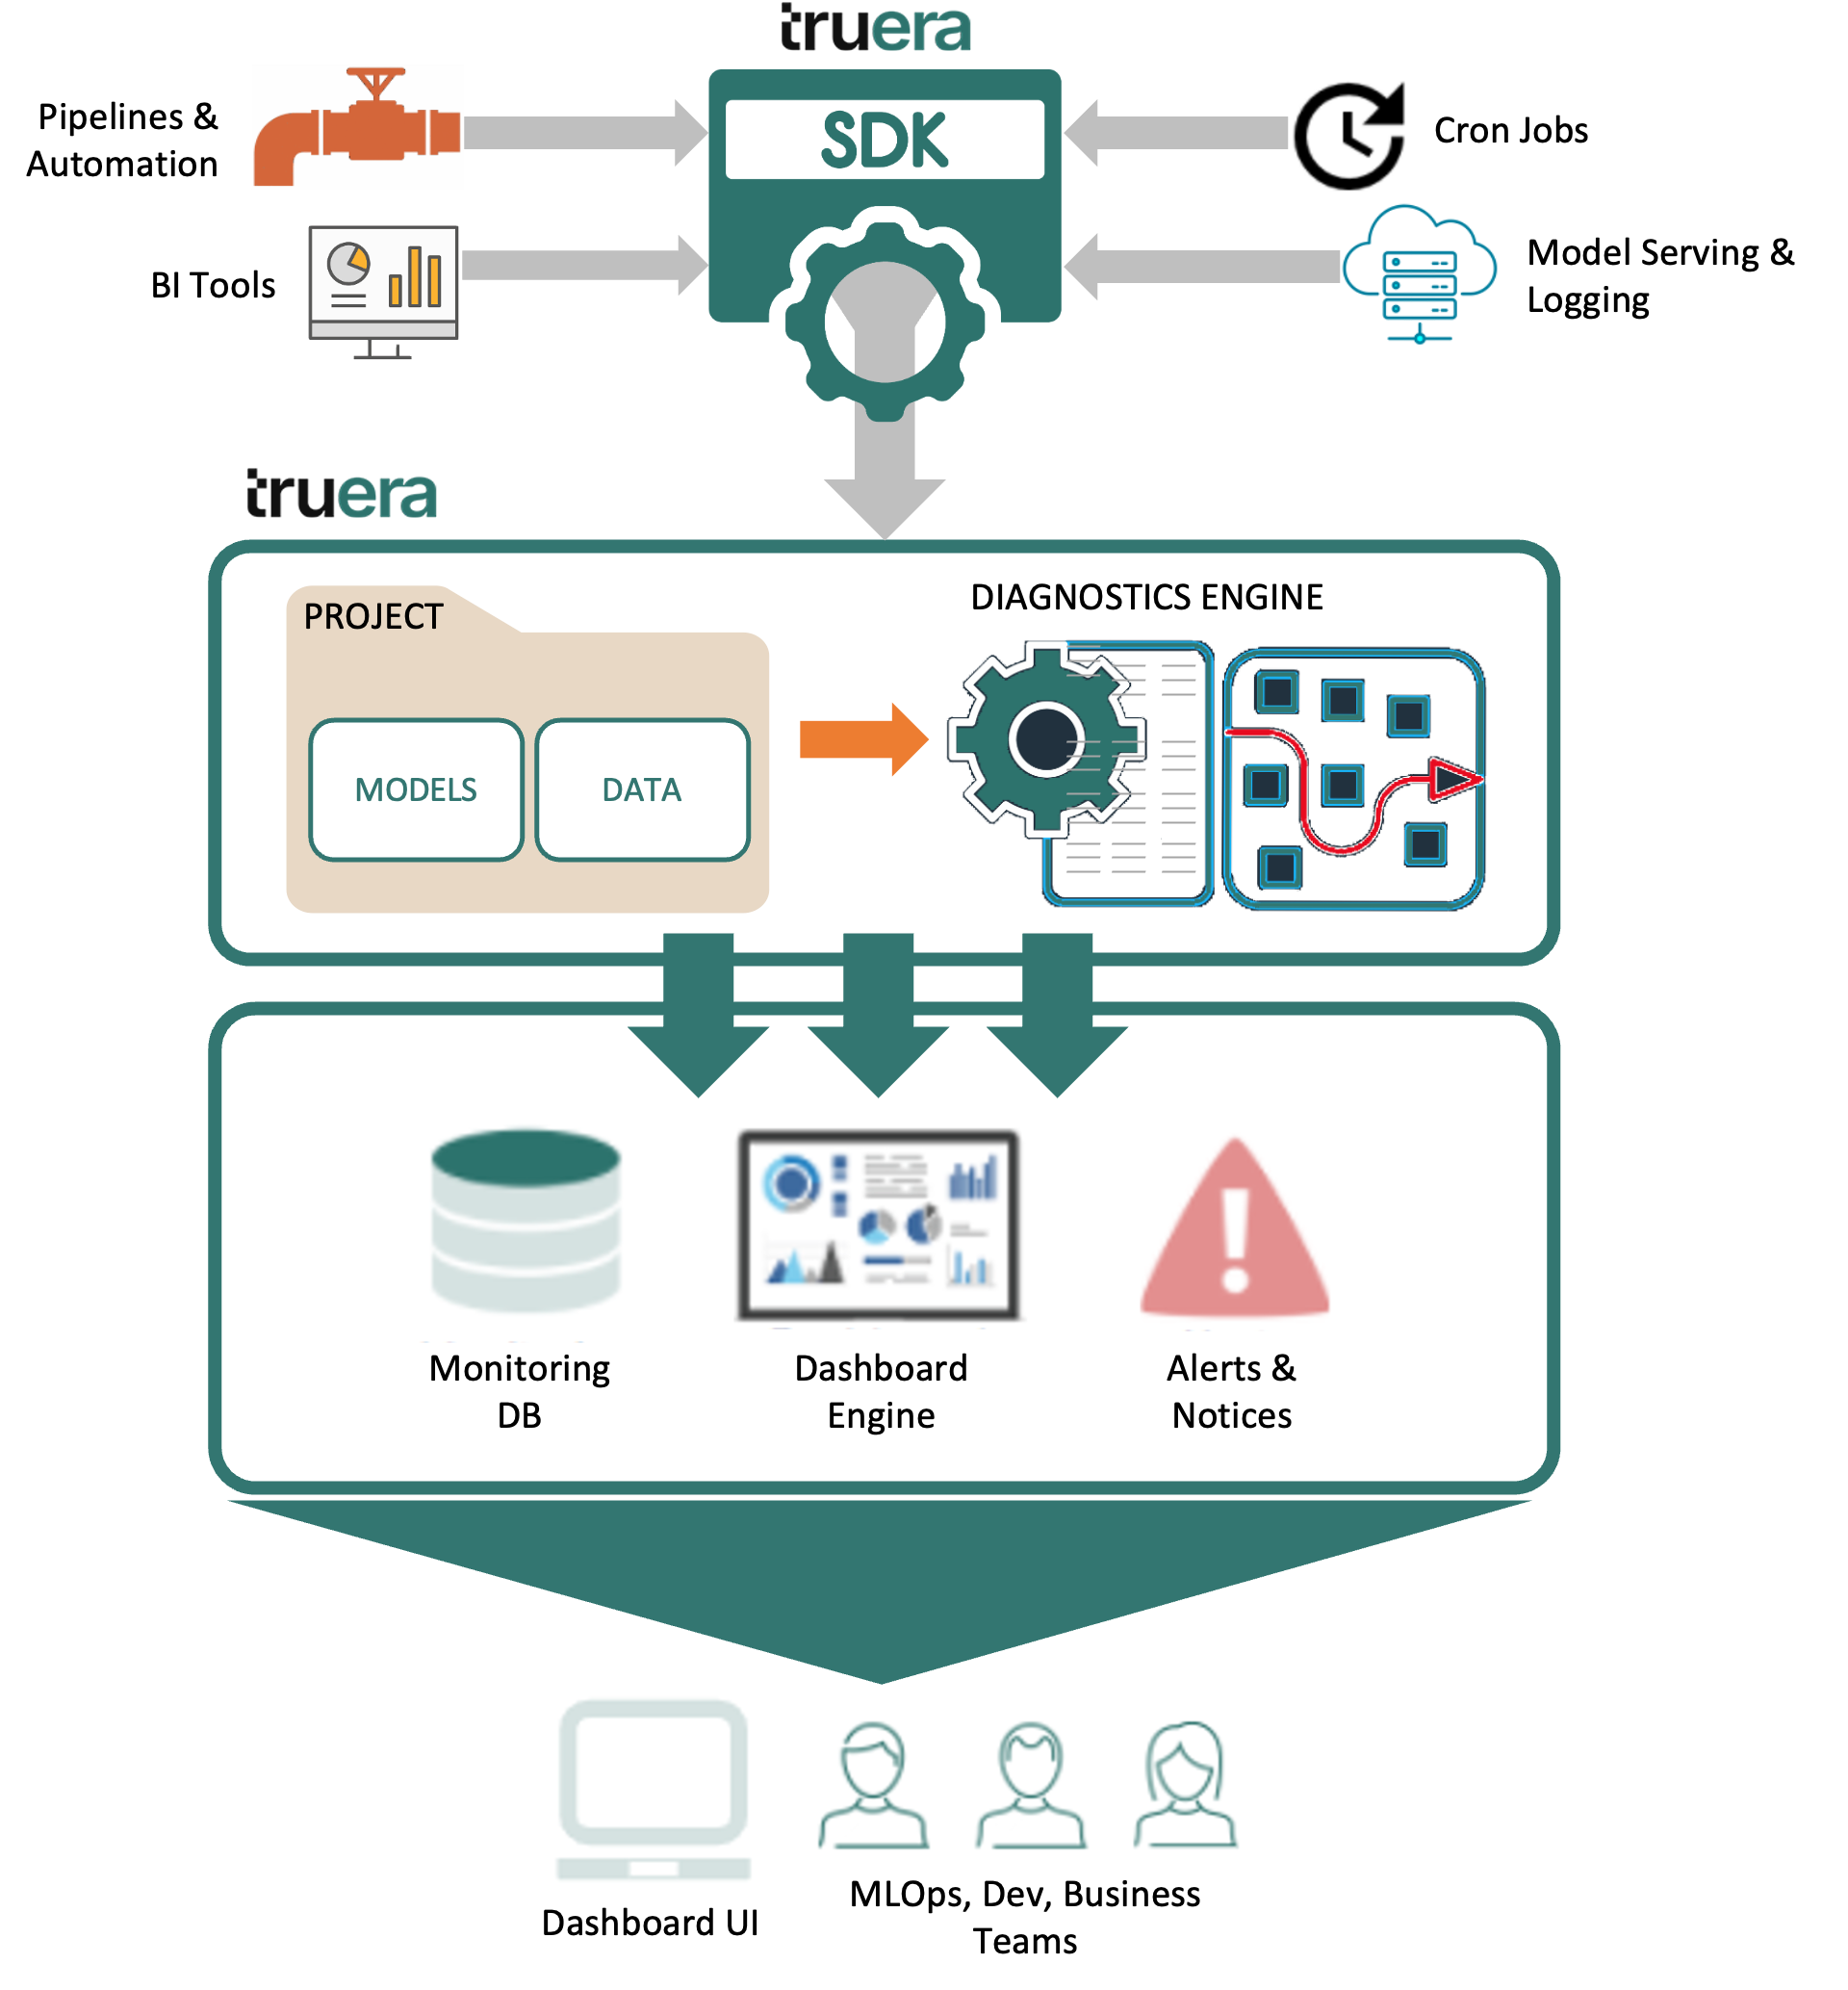
Real-Time Production Analytics with TruEra Monitoring
A live serving of your model in production may very well exhibit behavior you hadn't anticipated during the model training and testing phase. But how will you know unless you continuously monitor model inputs, output, and ground truth labels for performance and quality?
TruEra Monitoring assists you by:
- Monitoring at scale – ingesting production inputs, outputs, labels and feature influences for any size use case you have.
- Setting up best practice monitoring dashboards for just about any use case in a couple of minutes (based on the data provided — inputs, model outputs, labels, custom metrics, and segment tags).
- Setting up alerts triggered by concerning behavior, notifying you in real time whenever anomalous behavior occurs.
- Continuosly tracking the health and performance of your model and data feeds in real time based on what matters to you, including:
— Drift – feature, model, influence, and label drift using your choice of metric.
— Model Performance – using your choice of metric for regression and classification.
— Data Quality checks to measure how well a dataset meets your criteria for accuracy, completeness, validity, consistency, uniqueness, timeliness, and fitness for purpose.
— Trends and distributions for key metrics.
The Monitoring guidance included here walks you through how to do all of the above quickly and easily, beginning with how it all works.
How Does Monitoring Work?
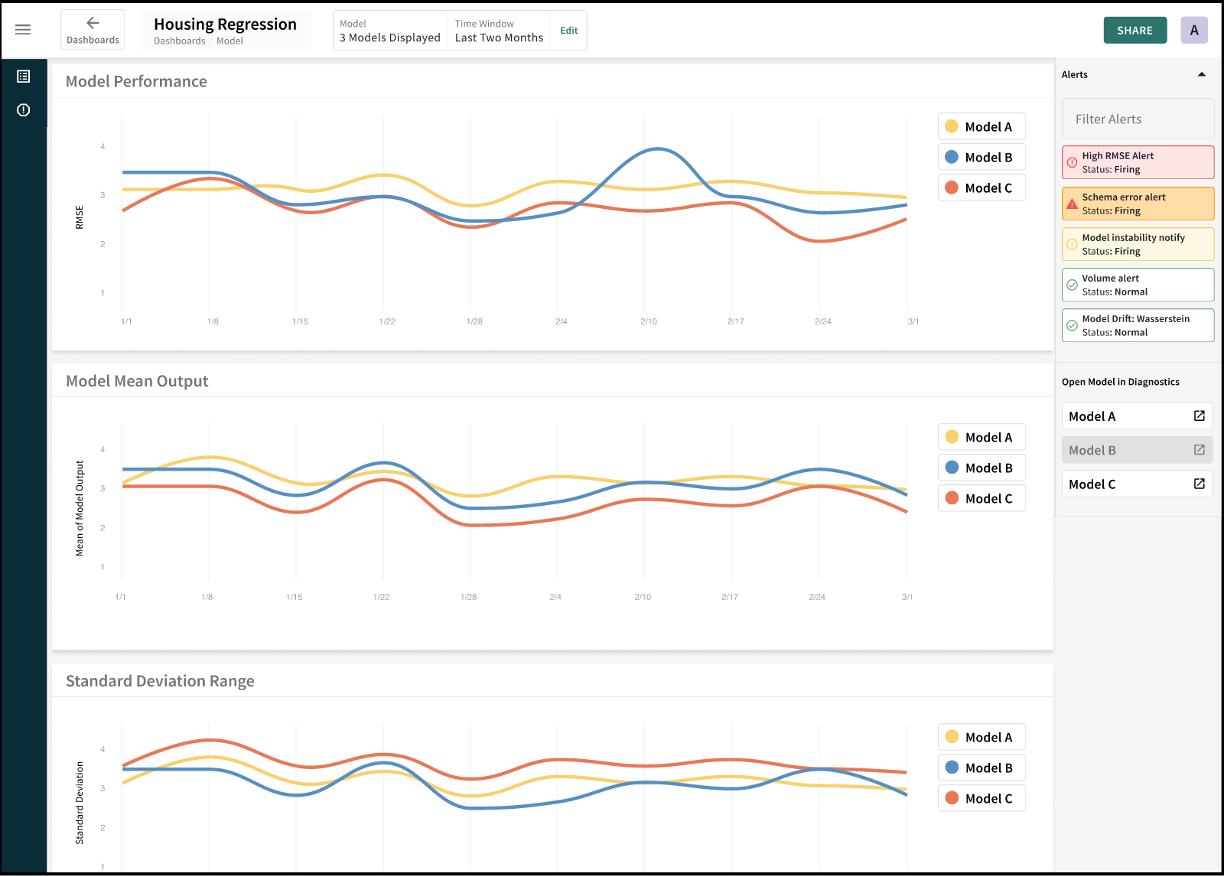
TruEra Monitoring captures your production model's quality metrics over time, presented and maintained in user-configured dashboards.
Performance Monitoring measures and tracks model performance based on time-series (daily or hourly) checks with the evaluation metric you set —
AUC
, RMSE
, Root Mean Square Error
also known as root mean square deviation – commonly used regression metric for evaluating the quality of predictions; measures the Euclidean distance between the prediction and the ground truth.WMAPE
, and more (see Supported Metrics for the complete list).Weighted Mean Absolute Percentage Error
sometimes abbreviated wMAPE – a variant of MAPE, absolute percentage errors are weighted by volume; used to investigate the average error of model predictions over time.Drift/Difference of Means Monitoring measures and tracks distribution drift — the difference between two statistical distributions. It is not uncommon for real-world production data to deviate from training parameters over time. TruEra measures drift to identify whether your models have grown stale, you have data quality issues, or there are adversarial inputs in your model.
Two distance metrics are currently supported: difference of means and
Wasserstein/EMD
and aka Earth mover distance – the difference between probability distributions on a given metric space M over a time range
Difference of Mean
.(X1, X2):=| 𝐄X1 – 𝐄X2 | for a time range
Drift can be measured for model inputs/features, model outputs, and label distributions against either training data or a known "good" production time period, which is often useful for third-party models.
Data Quality (Inputs) Monitoring helps identify key data quality issues such as cardinality shifts, data type mismatch, missing data, and more.
Difference between Monitoring and Diagnostics Flows
SDK ingestion flows are fairly similar for TruEra Diagnostics and Monitoring.
The principal difference is that Diagnostics for model development focuses on splits — breaking the training data into train, test, and validation datasets to evaluate the model during the training process. Once a split is created, it is static and immutable, since it’s important to know what the model version was evaluated for posterity.
By contrast, Monitoring does not use splits. Instead, all data goes into a "prod" dataset, which is added to continuously with inputs/outputs, labels, and custom data for each prediction via batch ingestion or streaming.
Because labels can sometimes be delayed, this data is ingested only as it becomes available, tied to the original prediction via a prediction_id.
Whan an anomalous time period is identified in a monitoring dashboard, that time window or its segments can be saved as a filter and inspected as if it were a split in TruEra Diagnostics. In this way, performance and
RCA
can be done by comparing that particular time period against the training split.Root Cause Analysis
A range of approaches, tools, and techniques used to uncover the root cause of a problem, identifying those factors that set in motion the entire cause-and-effect reaction that ultimately led to the problem(s).Click Next below to continue.