Organizing Your Work
Work throughout TruEra, both Monitoring and Diagnostics, is organized into projects (see Project Structure for a quick overview).
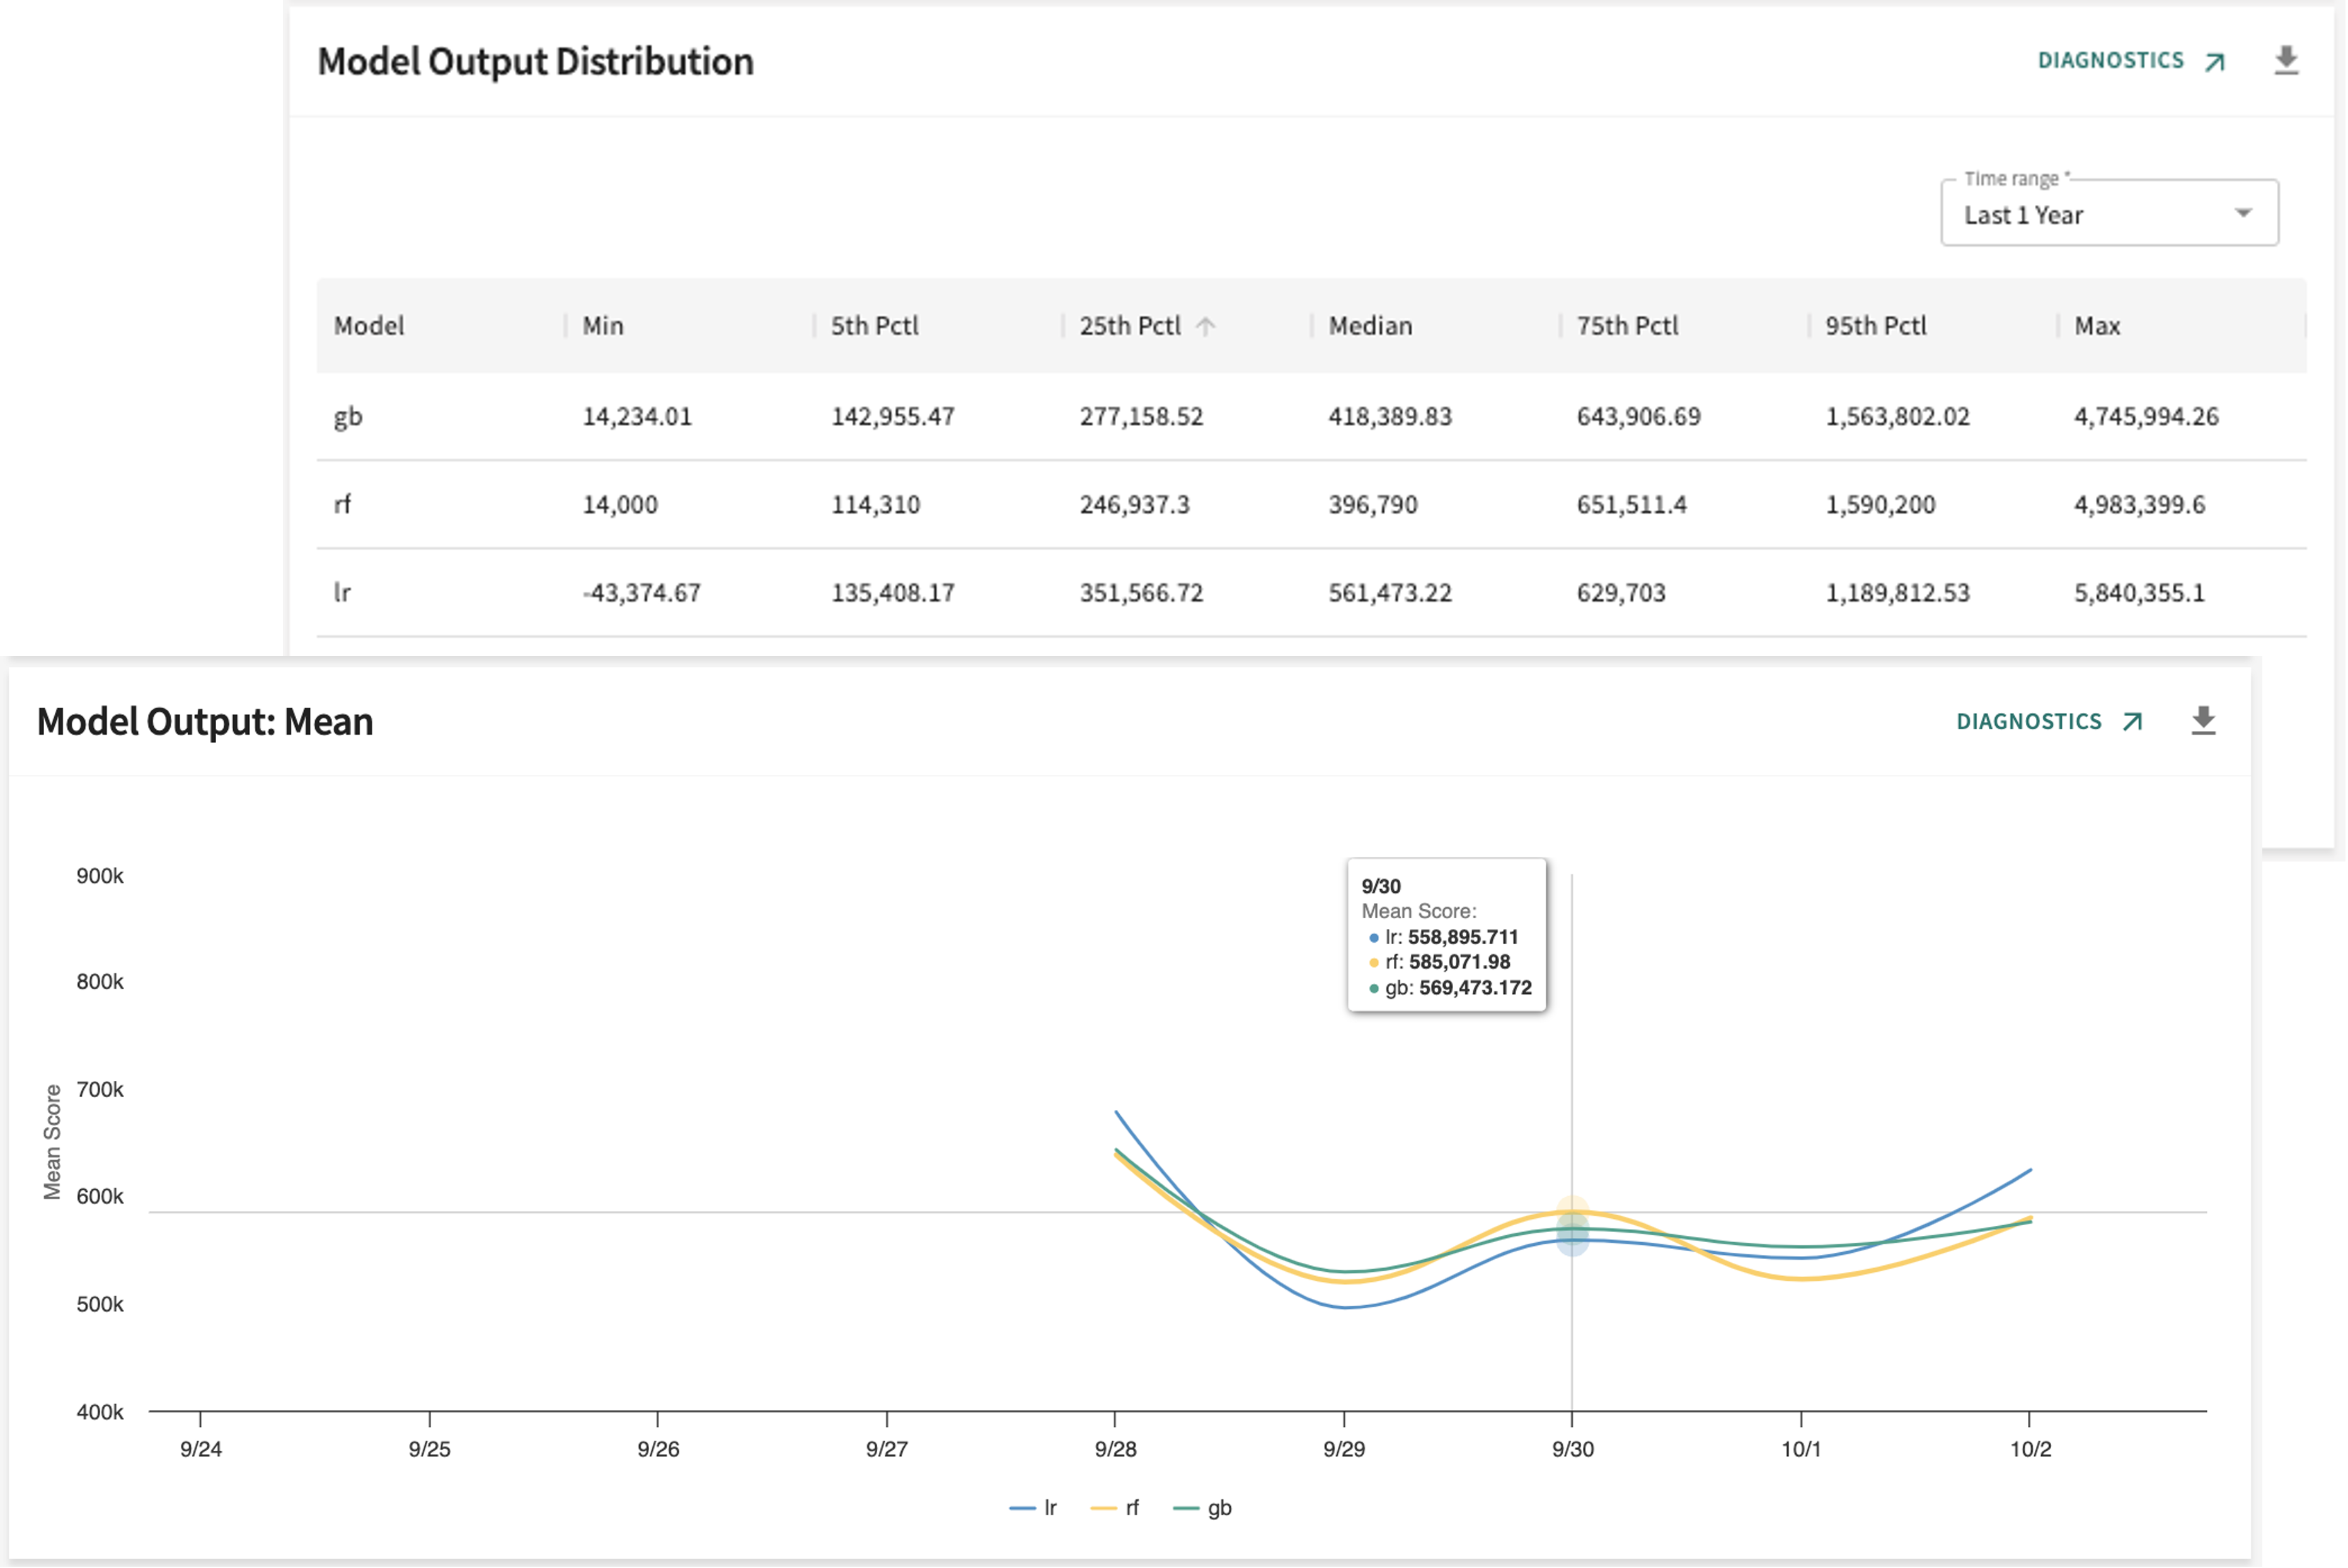
In addition to discrete projects, TruEra Monitoring lets you organize your production models and data into individual or combined views by configuring a variety of dashboard panels, each tracking model results over time based on a selected metric. Depending on the most commonly accepted representation of a given metric, a panel's display may plot the results on a two-dimensional X/Y graph or correlate the results in tabular form as shown in the examples below.
For more on setting up and changing your dashboard panels, see Creating a Dashboard. To explore the various panel displays, see Panel Organization.
Click Next below to continue.