More on NLP Explainability
In tabular datasets we try to explain model behavior using feature influences. Since NLP models do not have typical features, explaining NLP models follows a different approach. For models that use tokens, we try to understand how much influence did tokens have in the final outcome per record and at an aggregate level.
Once you have ingested token influences for a model and split, you can use the Explainabilty section of Truera Diagnostics to understand the relationship between tokens and the final model outcome.
Sign in to your account at app.truera.net. In the Web App, open a NLP project and navigate to Performance under Diagnostics.
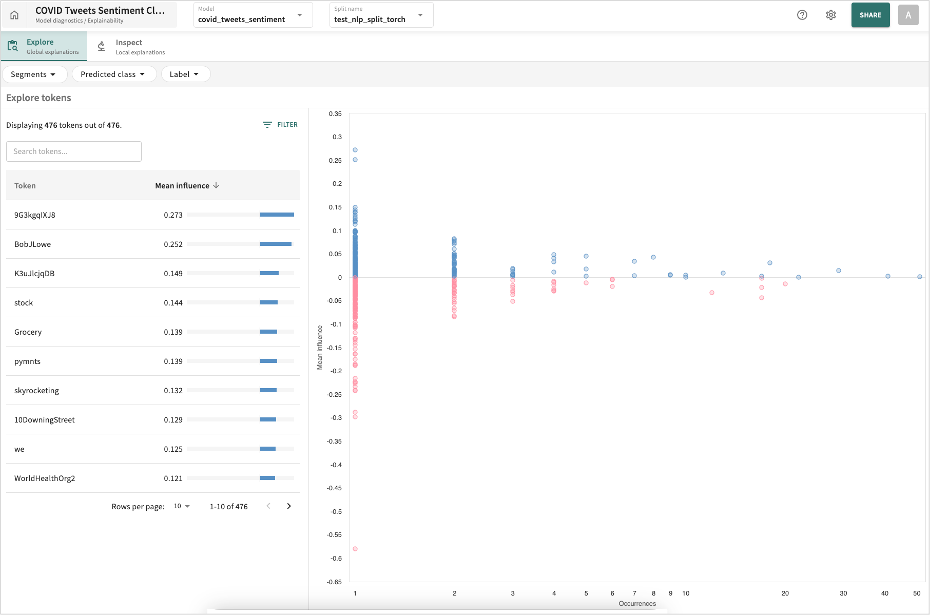
Explore
The Explore tab allows you to look at an aggregate of the influence of each token towards a particular class. You can sort to find the most influential and least influence tokens and also see how often they occur in your current data split on which the model is being scored. You can use the filters on the token influence table to find interesting tokens to analyze further. You can also filter your data set using Segments, Predicted Class or Labels.
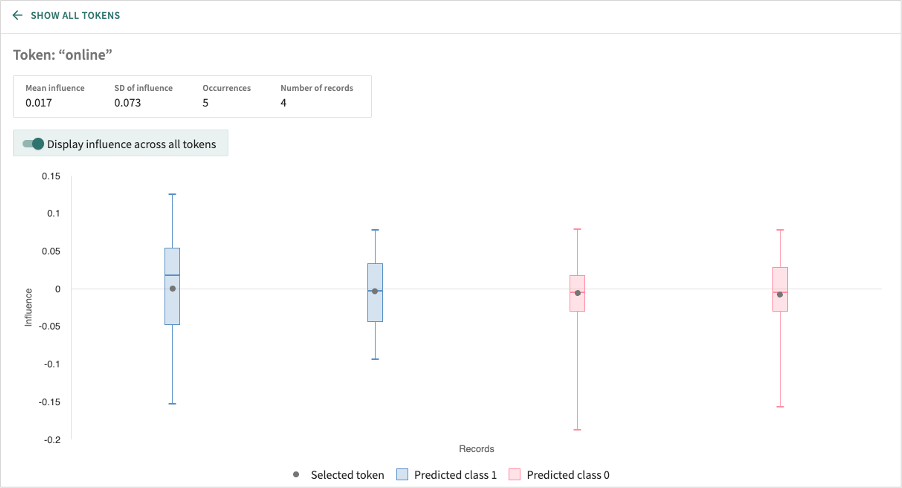
You can pick a particular token to analyze further either by clicking on a row on the table on the right or clicking on a point in the token influence chart. This visualization shows for each record what is the influence of the selected token and if Display influences across all tokens is enabled then you can see where the selected token's influence falls across the distribution of all the token influnces for a given record which helps assess the relative impact of the selected token in that record.
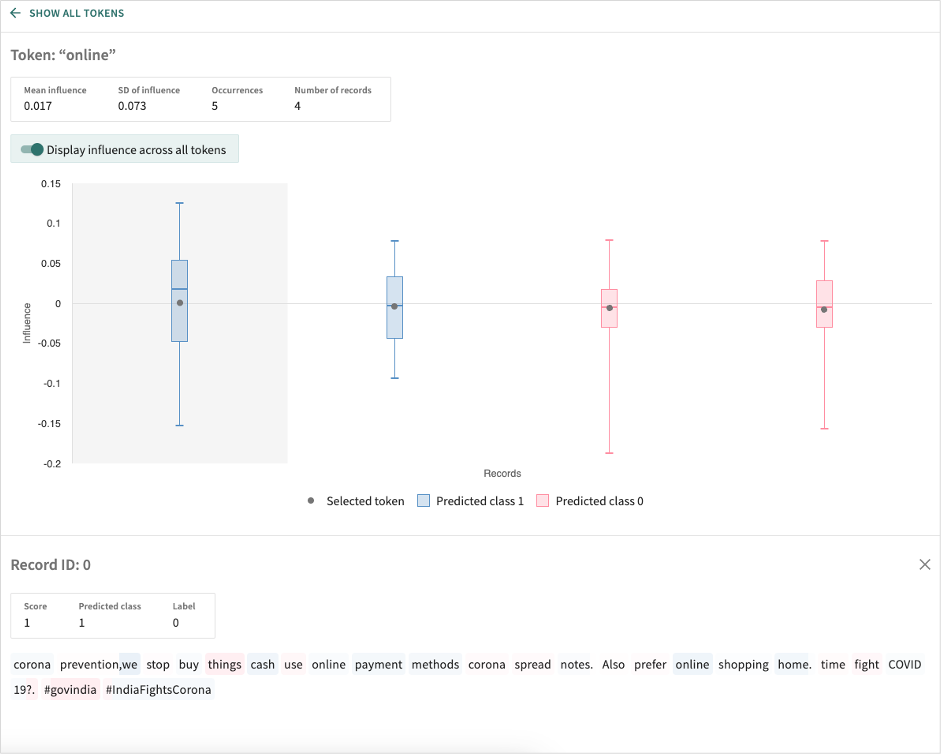
Dig deeper into a particular record by clicking on a point that pulls up the record and overlays the token influence as a color gradient. The brighter the color, the higher the token influence. You can also hover over the token to see its influence value.
Inspect
The Inspect tab allows you to go record by record to analyze how the tokens are influencing the final outcome. Filters applied on data splits are carried over.
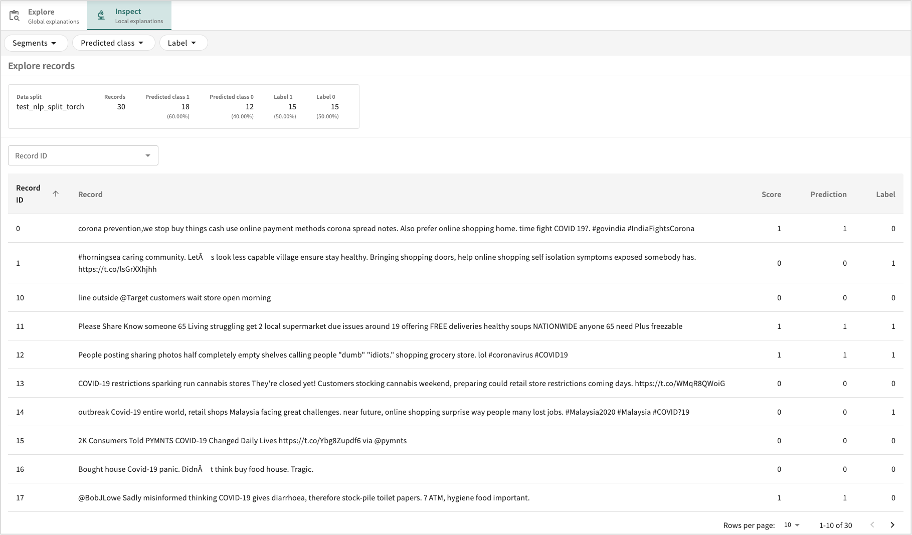
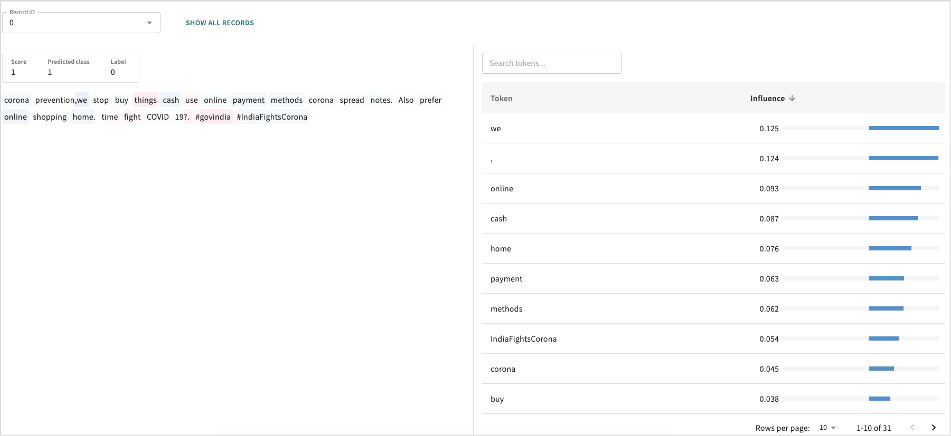
Clicking on an individual record, you get to see all the tokens and their influence on the final outcome along with Score, Prediction and Label.
Click Next below to continue.