Area Under the Curve
also known as C-statistics, ranges from 0 to 1; measures the two-dimensional area underneath the ROC curve.Managing Your Dashboards
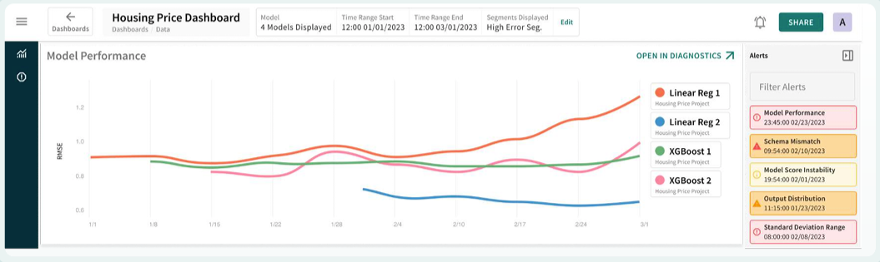
TruEra's comprehensive Monitoring Dashboards show you model and performance statistics across a broad range of metrics, with distinct panels displaying:
- Model Performance - to track classification and regression performance with industry-standard measures like AUC,RMSE,
Root Mean Square Error
also known as root mean square deviation – commonly used regression metric for evaluating the quality of predictions; measures the Euclidean distance between the prediction and the ground truth.WMAPE, andWeighted Mean Absolute Percentage Error
sometimes abbreviated wMAPE – a variant of MAPE, absolute percentage errors are weighted by volume; used to investigate the average error of model predictions over time.NDCG, among othersNormalized Discounted Cumulative Gain
a measure of ranking quality by taking into account the position of relevant items in the ranked list. - Model Drift – to track score and label drift from the baseline
- Segment Performance - to define specific segments of your business and track performance over time
- Model Output and Label Statistics – average scores, distributions and other statics
- Data Drift - to identify features that have the most influence on drift
- Data Quality - to identify and track common data issues like invalid numerics, missing values, schema mismatches, out of range and unrecognized categorical values
- Custom metrics - to track performance for a particular segment of your data, as well as your own user-defined custom metrics.
Combined, TruEra Monitoring delivers multi-model support in a single UI, from which you can conduct analyses across models and filter for error-prone segments, simultaneously, with the following distinctions:
- Only panels applicable to the model type — regression, classification, and (coming soon) ranking — are shown.
- Panels are segregated by model and data
- Current data panels (drift, DQ, and volume) only apply to tabular models.
- By omitting ingestions of input data, panels can support image and NLP model monitoring by limiting ingestion to predictions, labels, and any custom or segment tags
For guidance on viewing, filtering, and understanding TruEra Monitoring dashboards and panels, click Next below.