Performance Metrics
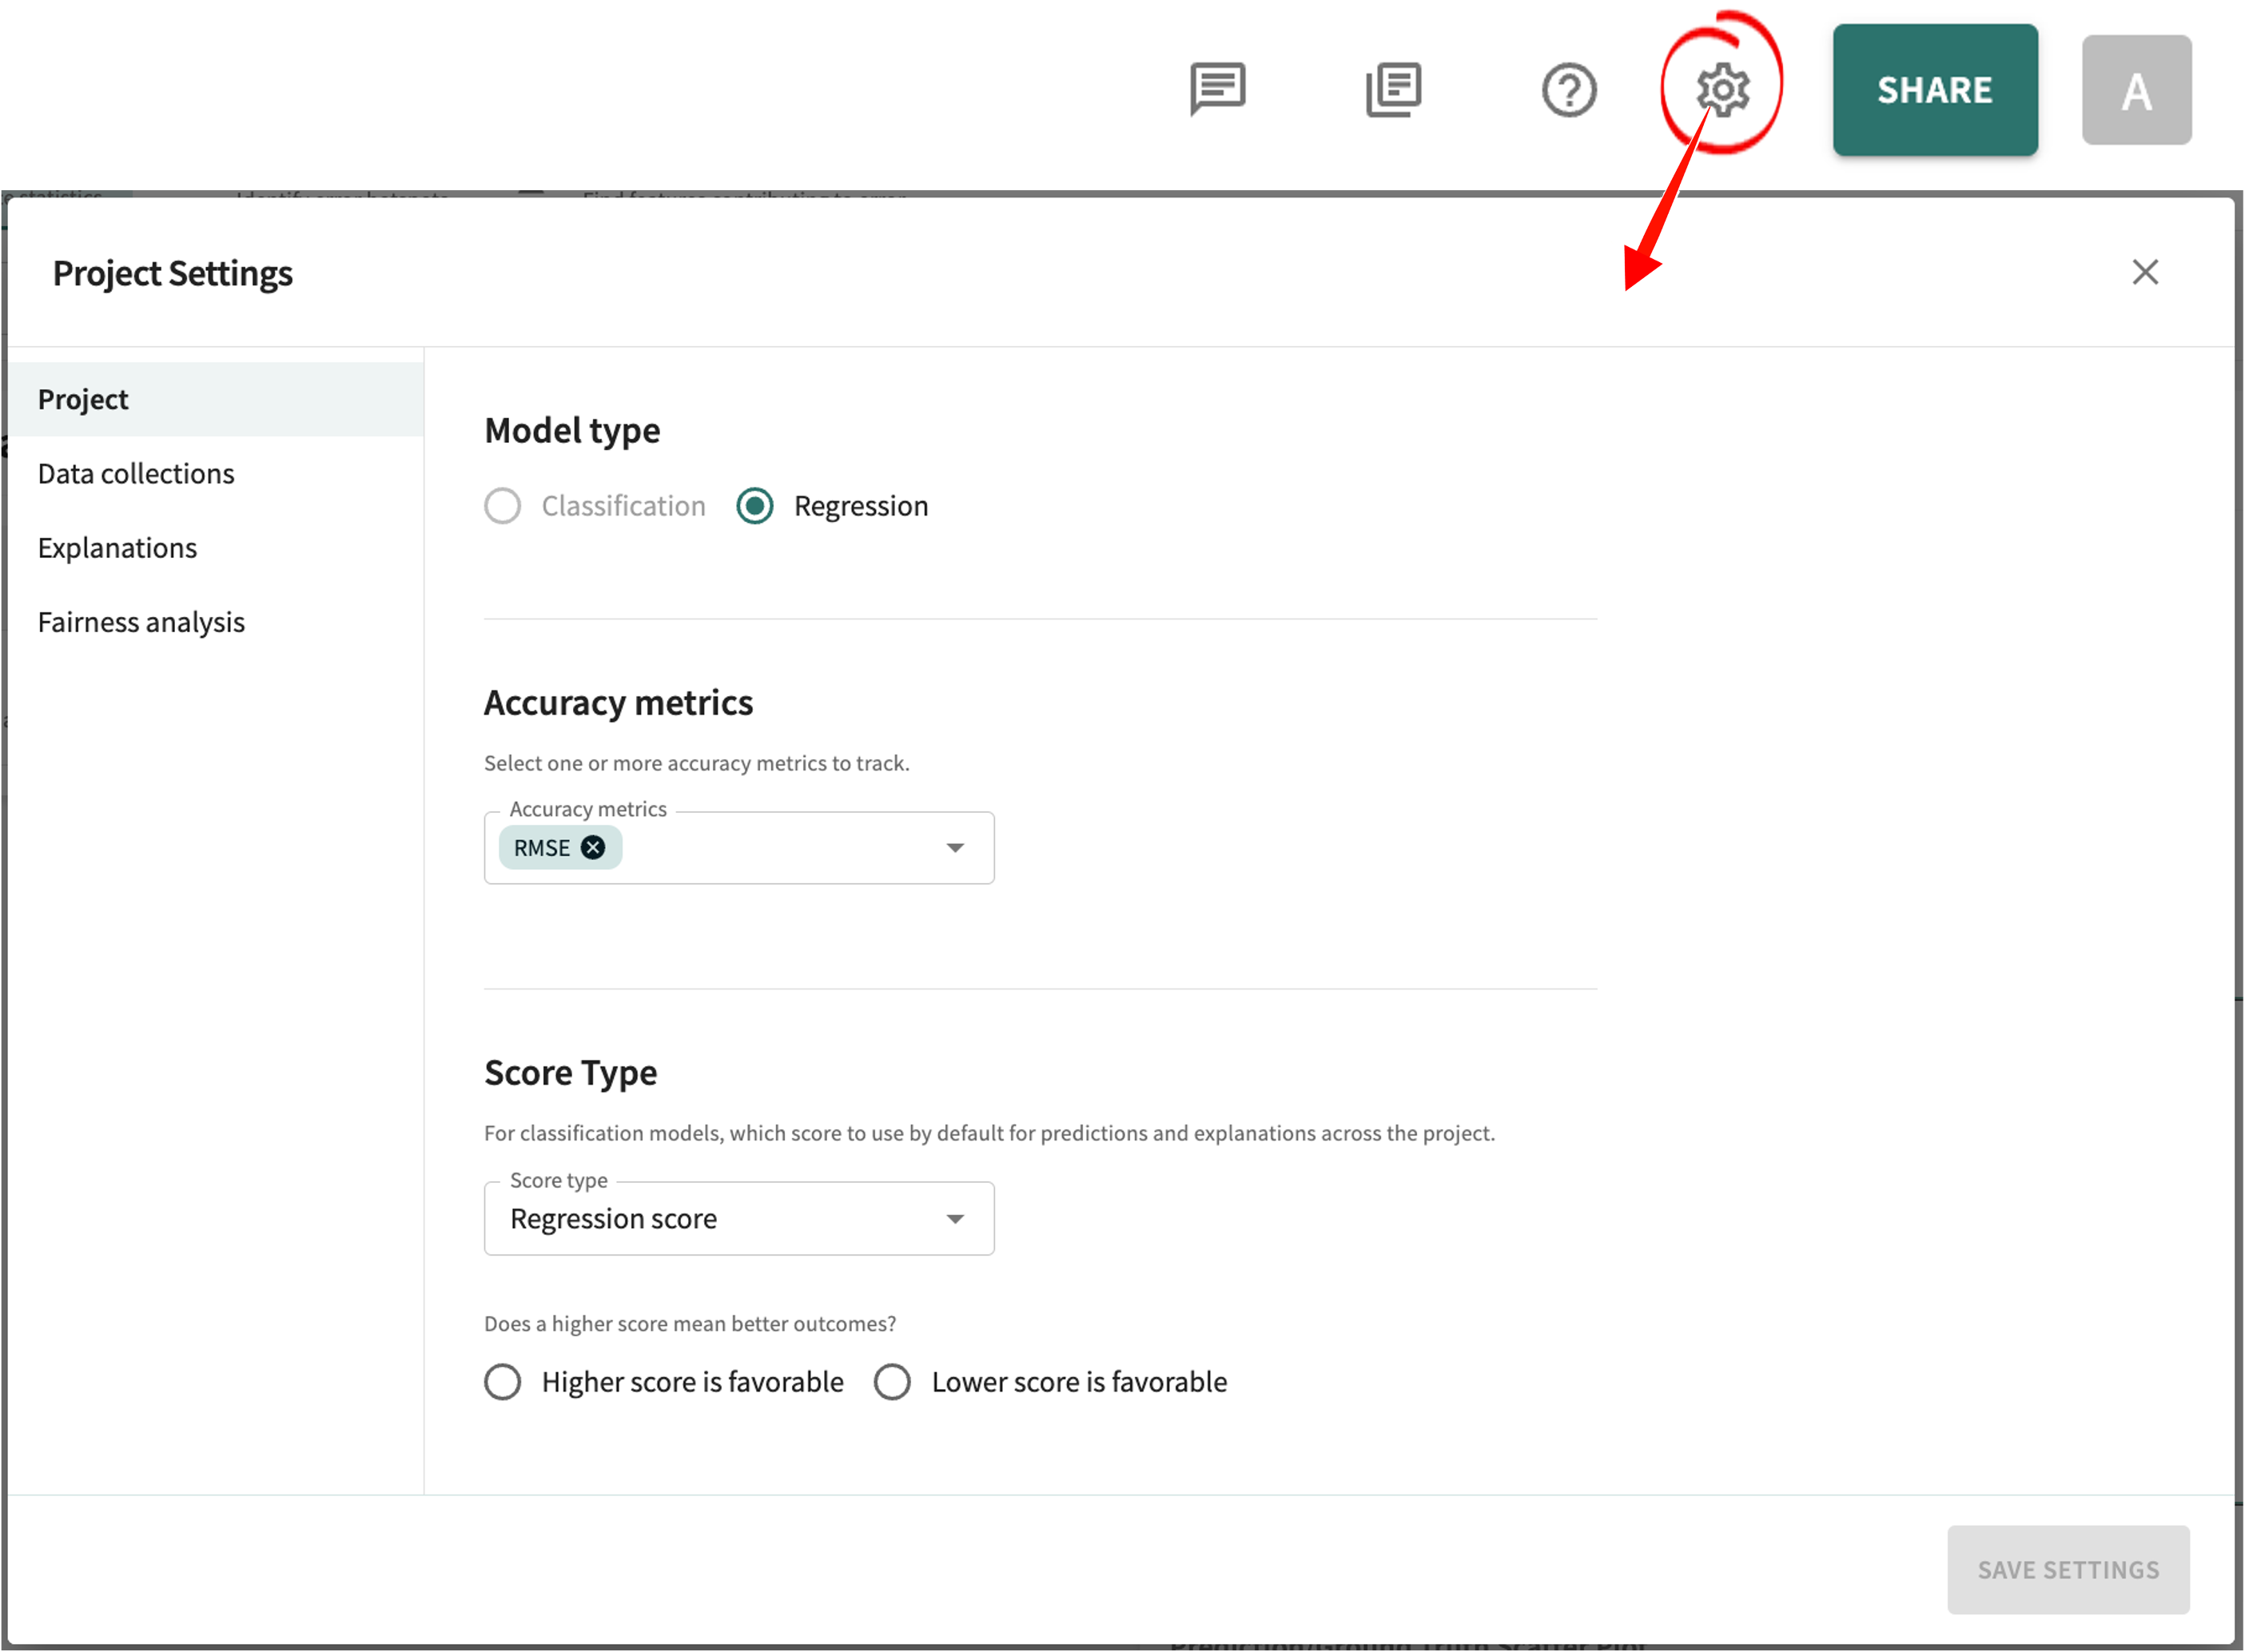
TruEra supports a wide variety of performance metrics for both classification and regression models. Accuracy checks are configurable. You can change the metrics for the selected project and/or model in Project Settings (pictured next) after signing in at app.truera.net.
Note
Measurements are labeled TP (true positive), FP (false positive), TP (true negative), and FN (false negative).
Classification Models
| Name | Range | Interpretation | Notes |
|---|---|---|---|
| AUC | [0, 1] | higher is better | Also referred to as AUC-ROC. Threshold-independent. |
| Segment generalized AUC | [0, 1] | higher is better | A segment generalized version of the AUC metric. Threshold-independent. |
| Classification accuracy | [0, 1] | higher is better | Requires a model threshold. |
| Precision | [0, 1] | higher is better | Requires a model threshold. Measures TP / (TP + FP). |
| Recall | [0, 1] | higher is better | Requires a model threshold. Measures TP / (TP + FN). |
| F1 Score | [0, 1] | higher is better | Requires a model threshold. Measures the harmonic mean of precision and recall. |
| True positive rate | [0, 1] | higher is better | Requires a model threshold. Measures TP / (TP + FN). Identical to Recall. |
| False positive rate | [0, 1] | lower is better | Requires a model threshold. Measures FP / (FP + TN). |
| True negative rate | [0, 1] | higher is better | Requires a model threshold. Measures TN / (FP + TN). |
| False negative rate | [0, 1] | lower is better | Requires a model threshold. Measures FN / (TP + FN). |
| Negative predictive value | [0, 1] | higher is better | Requires a model threshold. Measures TN / (TN + FN). |
| Average precision | [0, 1] | higher is better | Corresponds to the area under the precision-recall curve. Threshold-independent. For a precise definition, see here. |
| Jaccard index | [0, 1] | higher is better | Requires a model threshold. Measures the similarity between the label and predicted sets. |
| Matthew's correlation coefficient | [-1, 1] | higher is better | Requires a model threshold. Calculates the correlation coefficient between the observed and predicted binary classifications. For more details, see here. |
| Logloss | [0, +inf] | lower is better | Requires model probabilities. Also called logistic or cross-entropy loss. Calculates the negative log likelihood of the classifier given the true label per sample. |
| Gini coefficient | [-1, 1] | higher is better | Can be derived from ROC-AUC; see Glossary for a formal definition. |
| Segment generalized Gini | [-1, 1] | higher is better | A segment generalized version of the Gini coefficient metric. |
| Accuracy ratio | [-inf, +inf] | higher is better | Calculated as Gini score / (1 - P[Y=1]) |
| Segment generalized accuracy ratio | [-inf, +inf] | higher is better | A segment generalized version of the accuracy ratio metric. |
Calculation of Segment Generalized Metrics
Many model metrics (e.g., classification accuracy) are calculated as an average of a point-wise metric. Metrics such as AUC, on the other hand, cannot be broken down in a similar way and thus don't naturally generalize to segments of the data. As an illustrative example, consider if we have two segments of the data split: those with label 0 and those with label 1. Both of these segments would have undefined AUC scores regardless of the overall AUC.
To work around this, we generalize the AUC for a segment in the context of a data split in the following way:
where \(S\) is the segment, \(D\) is the entire data split, \(\delta\) is the identity function, and \(f\) is the ML model. By doing this, instead of computing a segment's AUC in a vacuum, we contextualize it in terms of the overall data split. This is especially useful for example in determining whether the segment in question is contributing negatively to the overall AUC and to what extent.
The Gini coefficient and accuracy ratio are derived from AUC and so to generalize them to segments we simply use the segment generalized AUC in lieu.
Regression Models
| Name | Range | Interpretation | Notes |
|---|---|---|---|
| MSE (mean squared error) | [0, +inf] | lower is better | |
| RMSE (root mean squared error) | [0, +inf] | lower is better | Equivalent to the square root of the MSE |
| MAE (mean absolute error) | [0, +inf] | lower is better | |
| MSLE (mean squared log error) | [0, +inf] | lower is better | Computes a risk metric equivalent to the expected value of the squared logarithmic error/loss; see here for a formal definition. This may be useful if targets grow exponentially. |
| R^2 | (-inf, 1] | higher is better | Measures the coefficient of determination of the regression model. |
| Explained variance | [0, 1] | higher is better | Computes the explained variance regression score. |
| MAPE (mean absolute percentage error) | [0, +inf] | lower is better | |
| WMAPE (weighted mean absolute percentage error) | [0, +inf] | lower is better | Variant of MAPE in which mean absolute percentage errors are treated as a weighted arithmetic mean; measures the performance of regression or forecasting models. |
| MPE (mean percentage error) | [0, +inf] | lower is better |
Ranking Models
| Name | Range | Interpretation | Notes |
|---|---|---|---|
| NDCG (normalized discounted cumulative gain) | [0, 1] | higher is better | Sums the true scores ranked in the order induced by the predicted scores after applying a logarithmic discount, then divides by the best possible score (Ideal DCG, obtained for a perfect ranking) to obtain a score between 0 and 1. |
Click Next below to continue.