Records
Being a core piece of model governance, clear and understandable model explanations will be demanded by operational stakeholders before decisions are made about deployment.
To help you understand the reasons for model behavior, TruEra's Records scoring lets you drill down into individual datapoints and explain your model at a local level.
Scoring
Scoring each record provides a means of automatically identifying those points where the model's performance may be unreliable. For instance, when the model sees a point very differently from what is typical or makes its decision based on a very small number of features. Operationally, these scores can be useful in identifying predictions that need a closer look. During development and validation, they can be used to identify potential data accuracy issues.
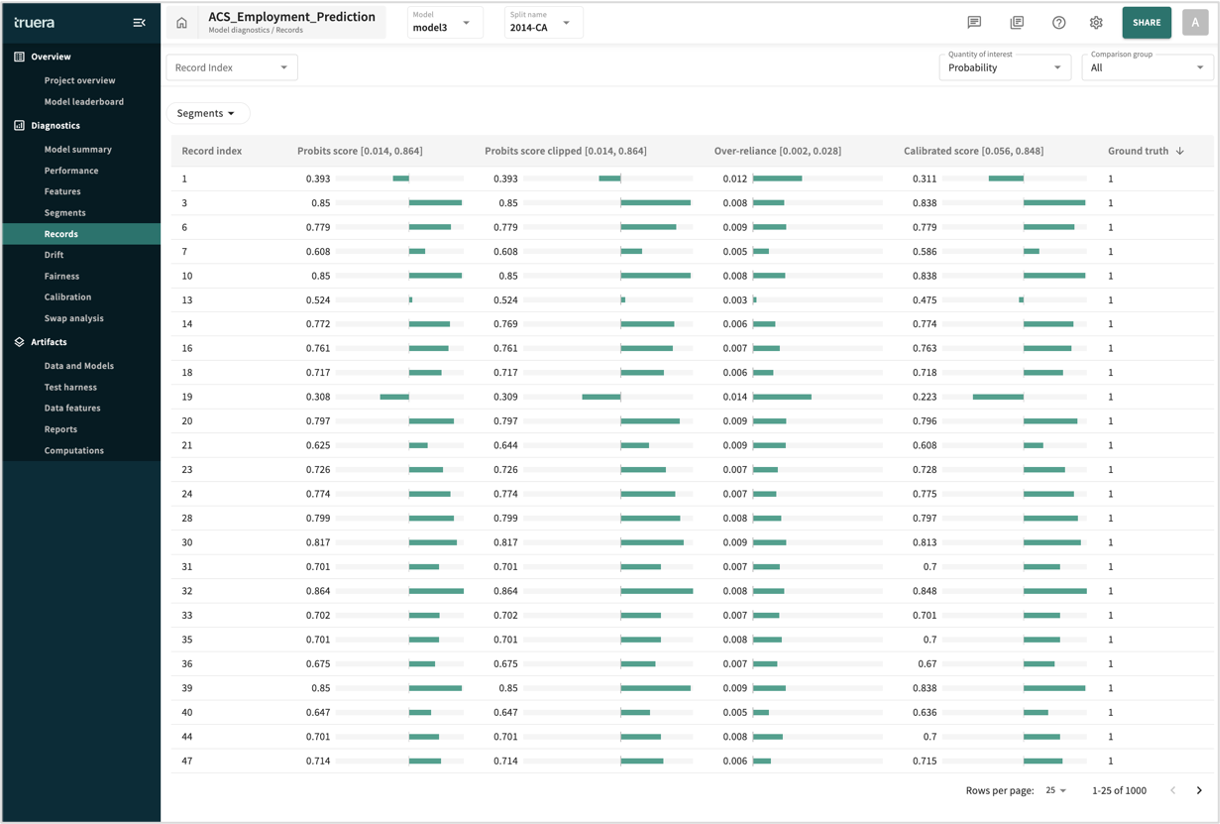
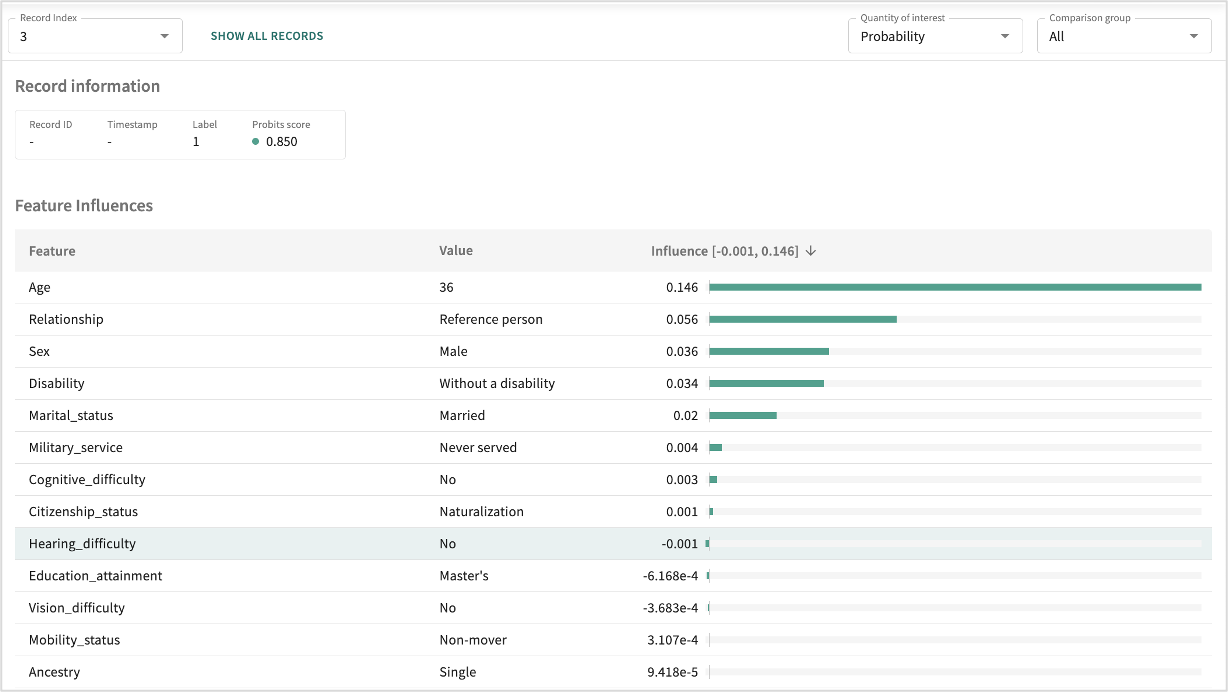
Pictured above, the list of feature influence scores can be sorted by the Records Index, a sequence identifier corresponding to each data point in the split. For more granularity, the list can be filtered by segments.
Quantity of interest and Comparison group are selectable. Compare point index must be specfied if different that the default (0).
For classification models, your scoring options are:
- LogitsThe raw outputs of a model before they are transformed into probabilities.
- Probability (probits)Likelihood that the item or event falls into one of a range of categories by estimating the probability that observation with specific features will belong to a particular category.
- ClassificationCompares the actual and predicted class of each data point, wherein each match counts as one correct prediction.
Each of these require that influences have already been ingested when SHAP is the influence algorithm selected in project settings (see Choosing an Influence Algorithm for details).
For regression model, the only option is Regression.
Scores reported based on the Quantity of Interest selected are:
- Score – vector of raw predictions (not yet normalized).
- Score clipped – QII values clipped to lie within a reasonable range, adjusted for unusual behavior in outlier features to reduce cumulative score distortions during training
- Ground truth – the ideal expected result.
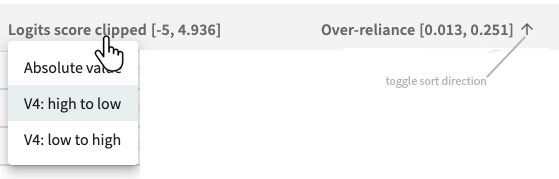
In all cases, sort the tabular results by clicking a column label, then select a sort criterion or click the arrow to change the sort direction.
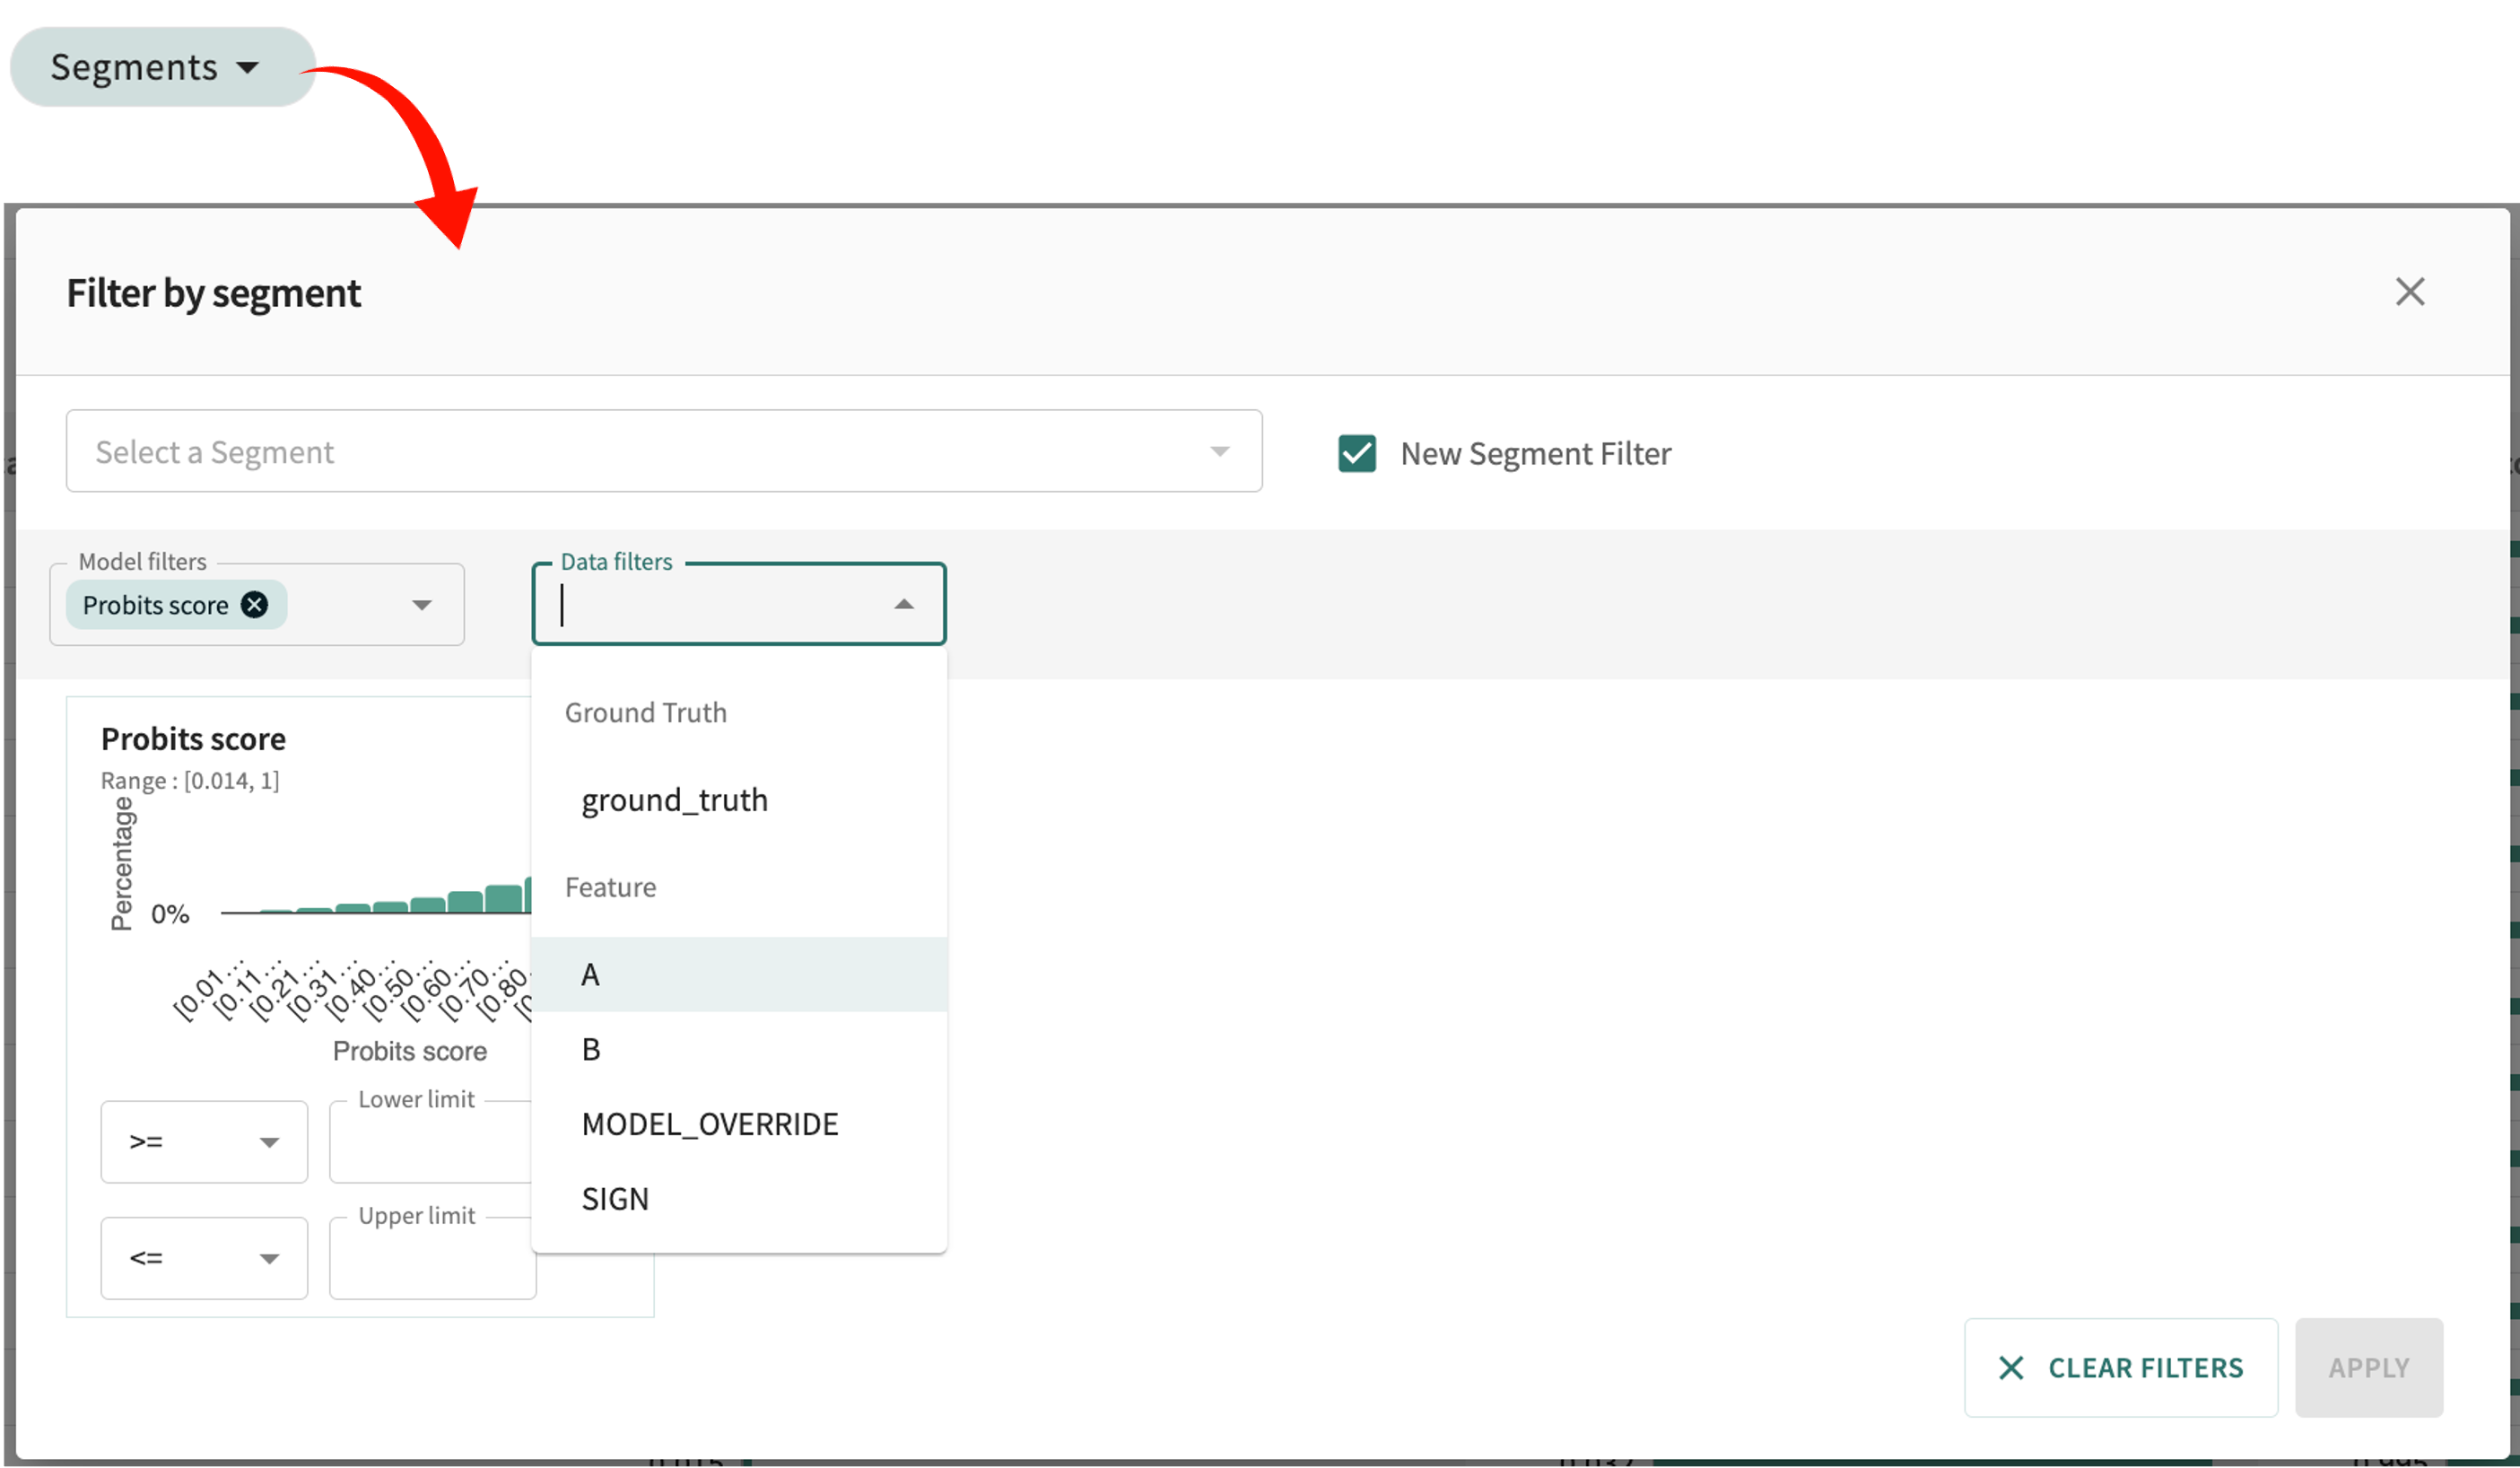
Set the number of rows displayed per page at the bottom-left of the table. Click Segments at the top of the table to confine the analysis to a defined segment or a specific feature value.
To see point-specific influence details (local explainability), enter/select the desired index number in the Record Index field or select a discrete record (row) in the list by clicking it.
Local Explanations
Model explainability simply means that the algorithm and its output (decision) can be understood by a human. It is the process of analyzing machine learning model decisions to assess the reason(s) behind them. Global explainability concerns the learning algorithm as a whole, including the training data used, appropriate uses of the algorithms, and warnings regarding weaknesses of the algorithm and inappropriate uses. Local explainability identifies which dimensions of a single input (data point) are most responsible for the model's output.
Here, we will focus exclusively on local explainability as a function of model diagnostics.
Open the details for a specific record by clicking its row or enter the desired index number in the Record Index field.
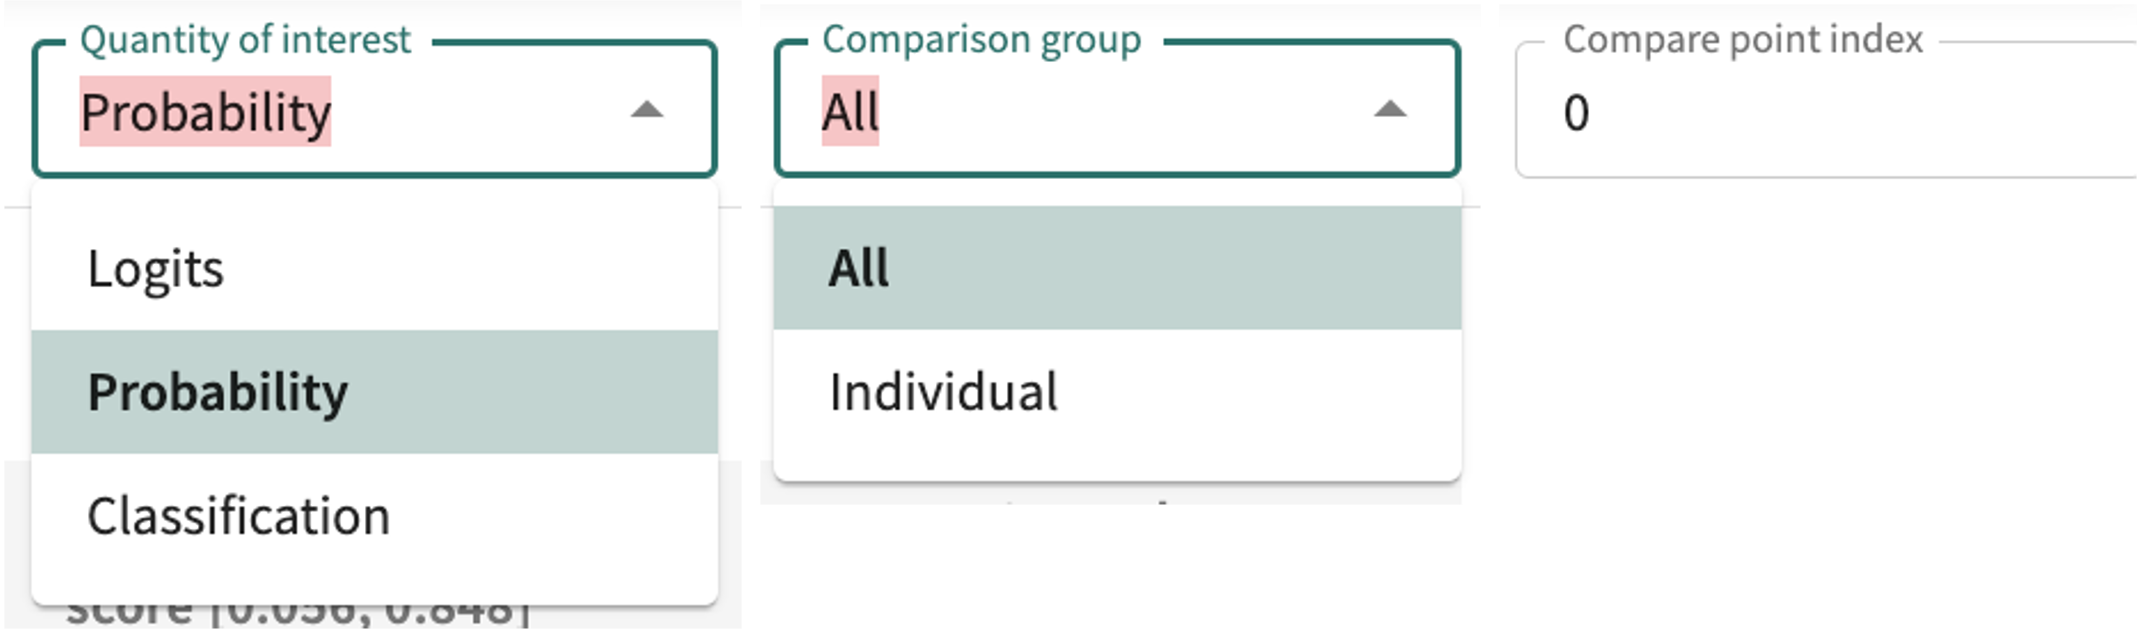
For classification models, you can change your measurement focus from Logits to Probability or Classification and back by clicking the Quantity of interest drop-down and making your selection. For regression models, select Regression to get the continuous model output.
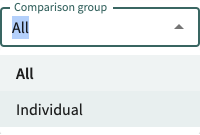
Change the comparison from All points in the split, to an Individual point comparison by clicking the Comparison group drop-down and making your selection, then enter the comparison record's index number in the Compare point index field.
Note
Generally, Logits as the Quantity of interest and All for Comparison group are sufficient.
Click a row in the Feature Influences table to see the details for a particular Feature.
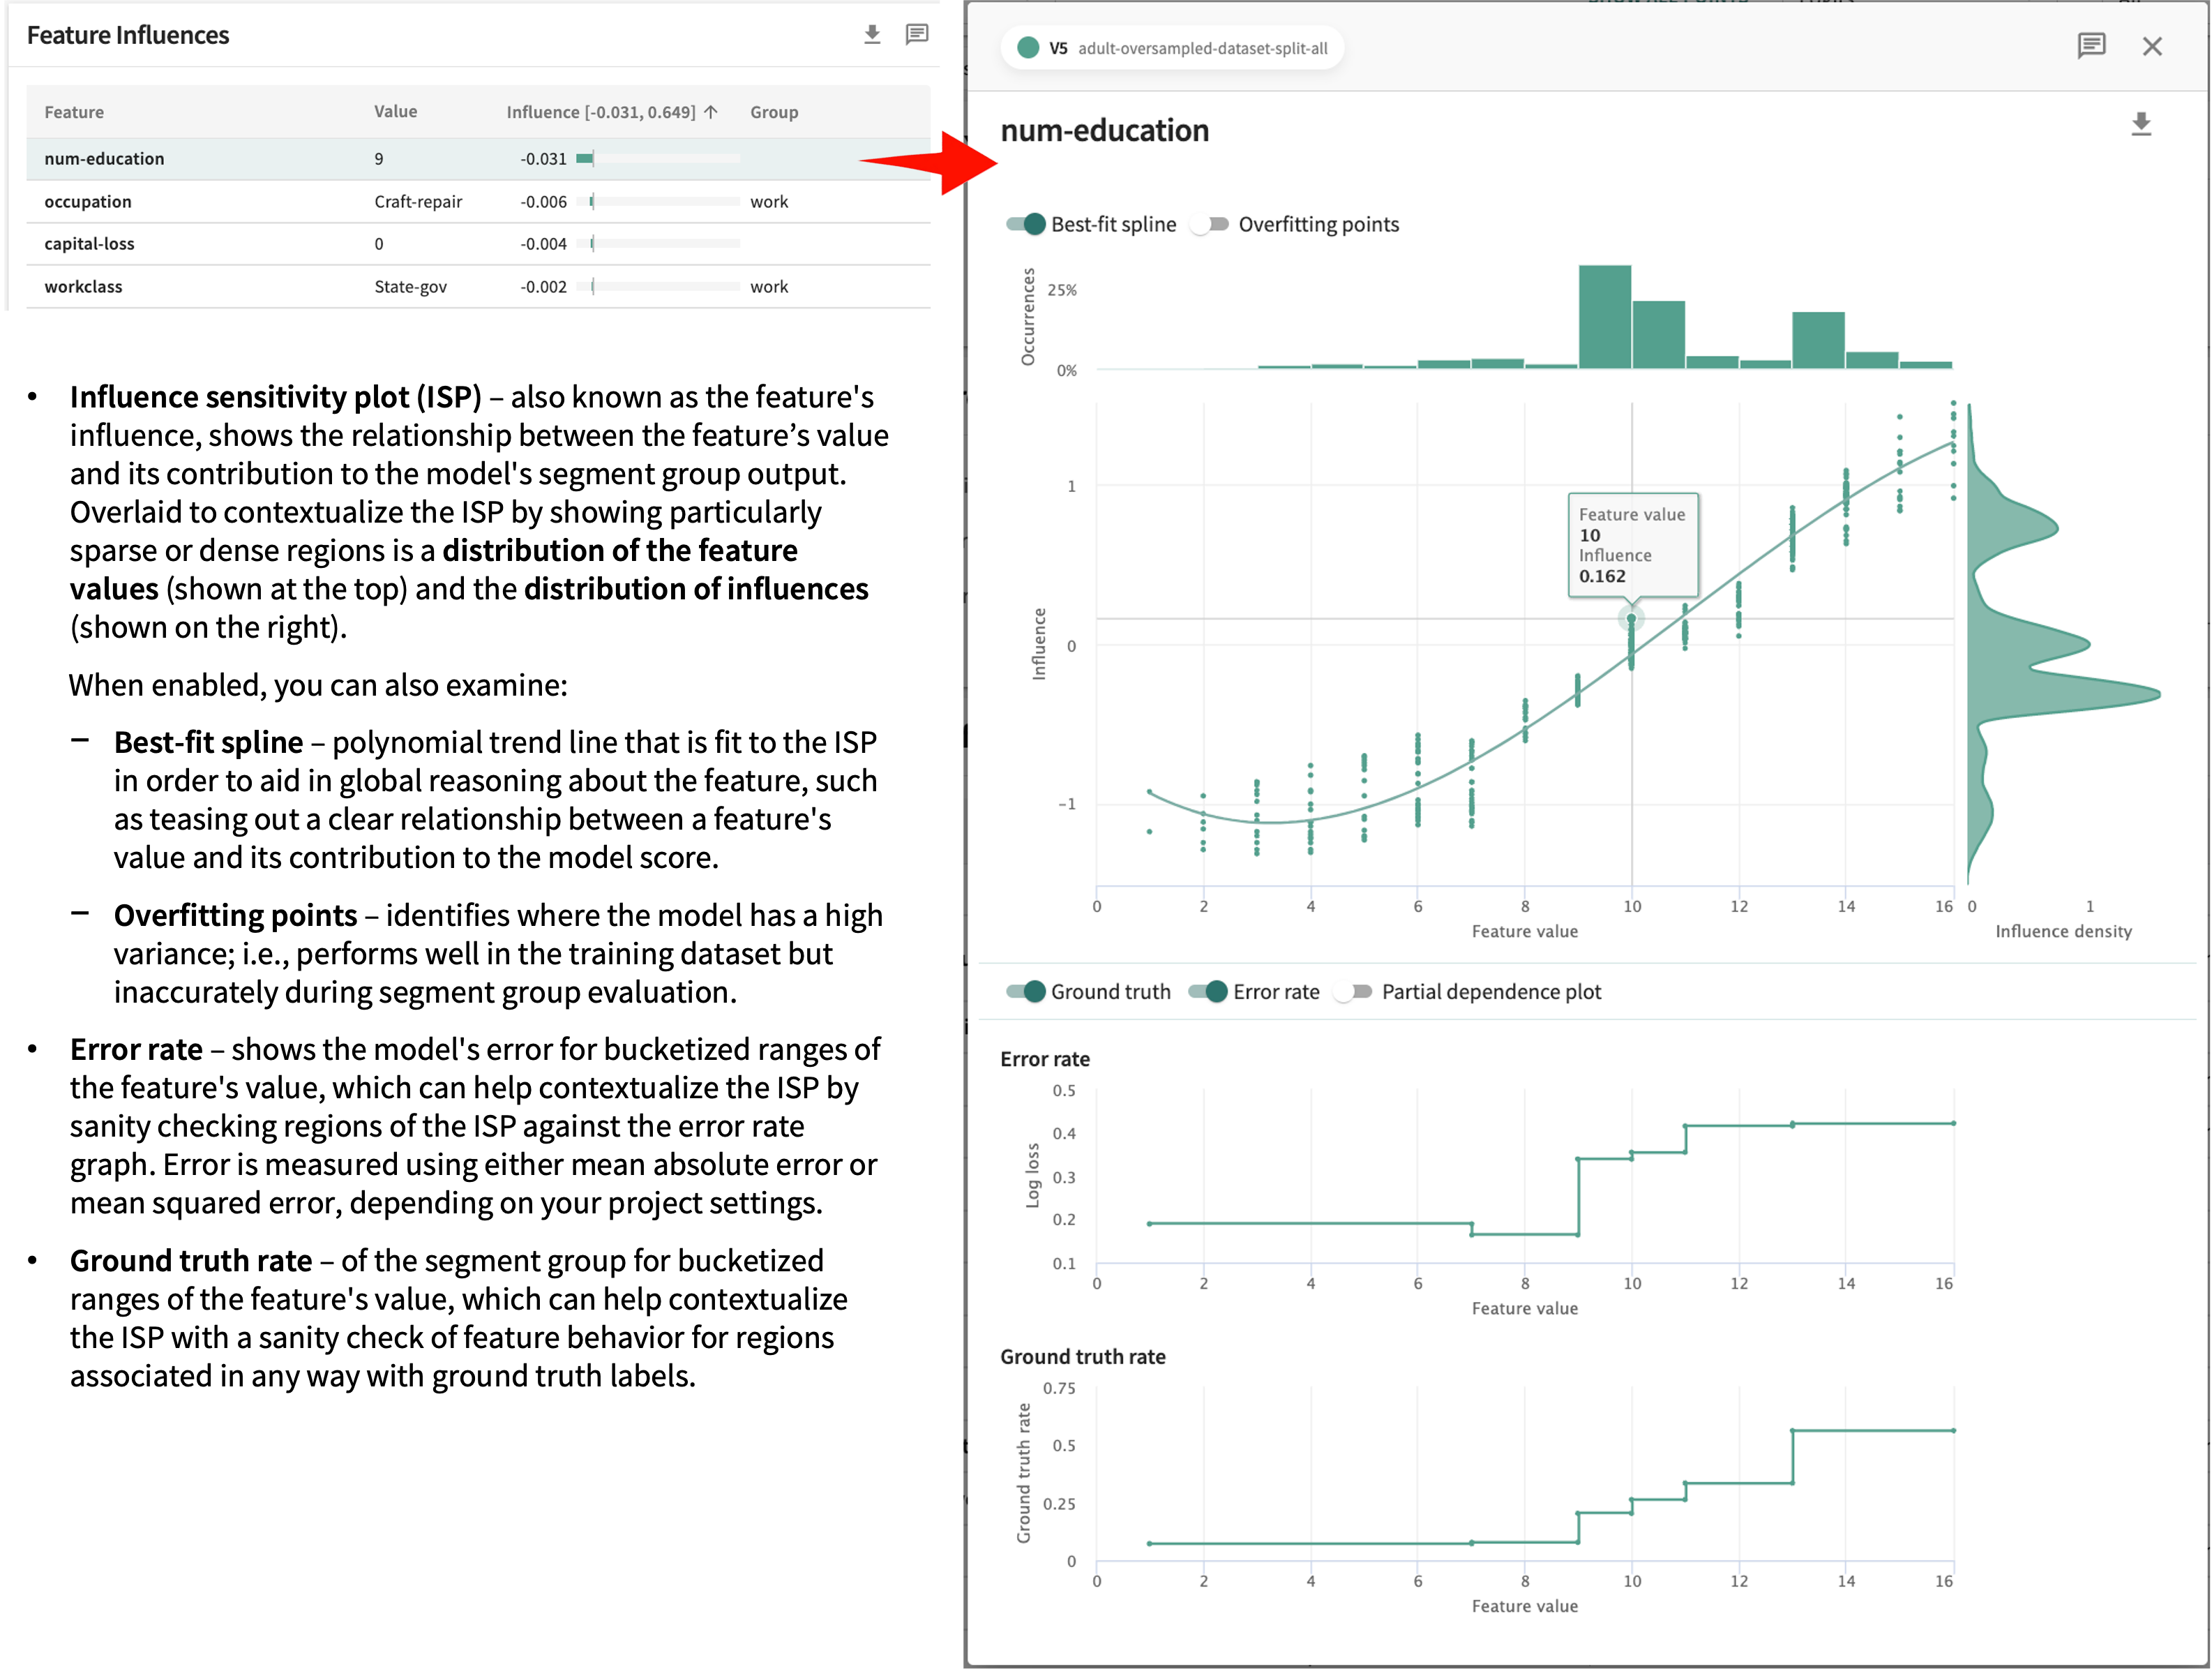
The influence scores and analyses found here for each feature in your dataset are designed to help you identify and shape your explanations for each specific record.
Click Next below to continue.
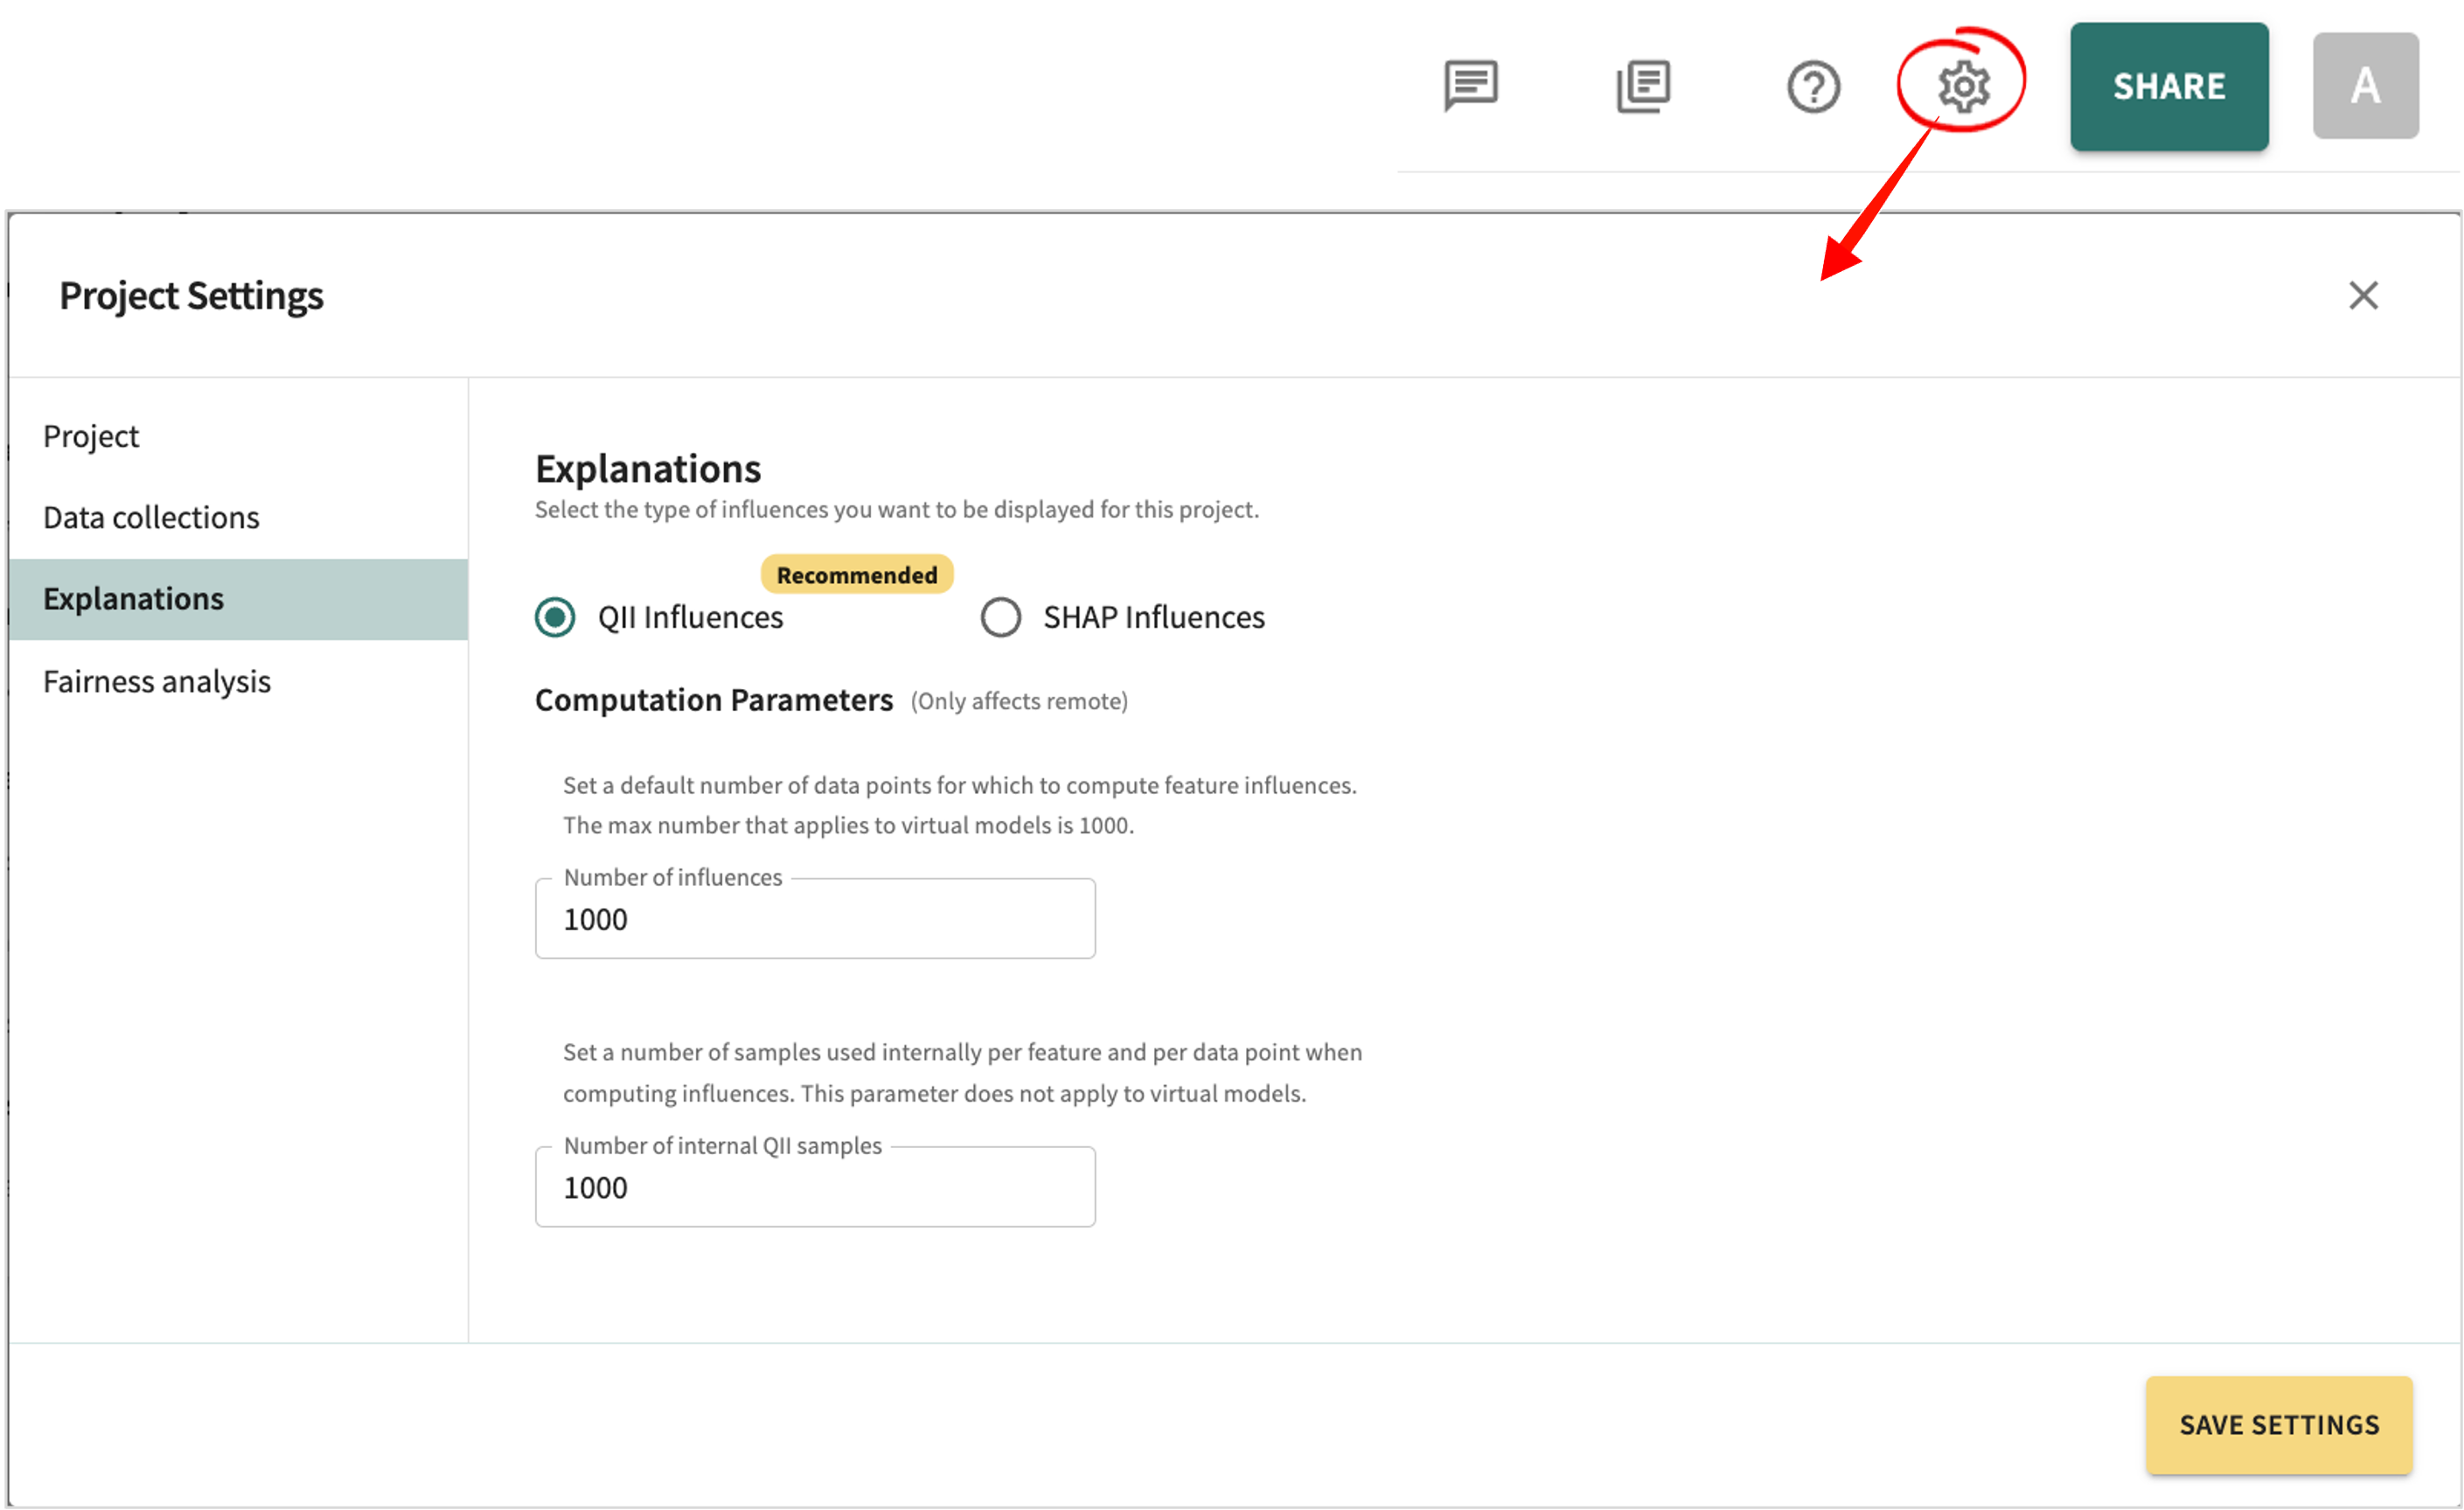
- Click the Project Settings widget in the Web App toolbar.
- click Explanations.
- Select the type of influences you want to display, either QII or SHAP (see Choosing an Influence Algorithm).
- Click SAVE SETTINGS.